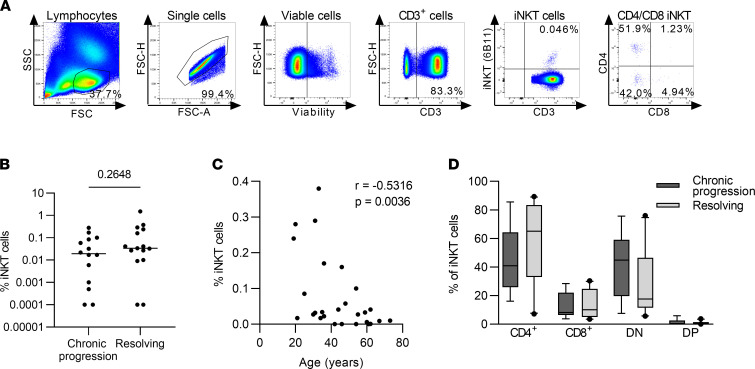
Figure 1. Frequencies of iNKT cells are stable during acute HCV infection.
PBMC samples from the acute phase of HCV infection from chronic progressors (n = 15) and resolvers (n = 15) were analyzed by flow cytometry. (A) Representative gating strategy for Vα24Jα18+ invariant NK T (iNKT) cells. (B) The frequency of iNKT cells of all CD3+ T cells 12 weeks after estimated time of infection (ETI). Groups were compared by Mann-Whitney U test. (C) Association of iNKT cell frequency with the age in years of the corresponding donor at 12 weeks after ETI was calculated by Spearman’s correlation analysis. (D) iNKT cells were subgrouped according to the expression of CD4 and CD8 into CD4+, CD8+, double-negative (DN) and double-positive (DP) iNKT cells. Box plots depict the frequency of CD4+, CD8+, DN, and DP iNKT cells at 12 weeks after ETI. Samples with less than 20 iNKT cells were excluded from phenotypical analysis.

