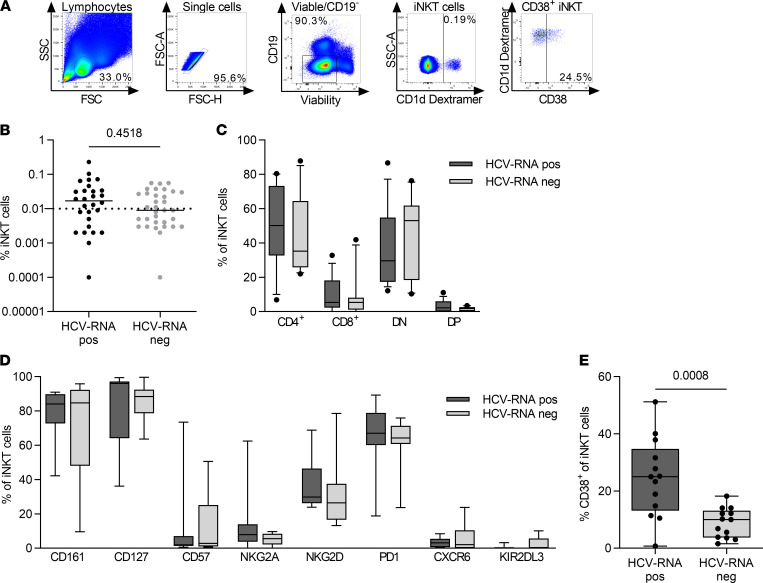
Figure 3. CD38+ iNKT cells are increased in HCV RNA–positive PWID compared with HCV RNA–negative PWID.
PBMCs from HCV RNA–positive (n = 28) and HCV RNA–negative people who inject drugs (PWID) with detectable HCV antibodies (n = 33) were analyzed by flow cytometry. (A) Representative gating strategy for CD1d dextramer+ invariant NK T (iNKT) cells. (B) The frequency of iNKT cells of all CD19– lymphocytes in HCV RNA–positive and HCV RNA–negative patients is shown. Groups were compared by Mann-Whitney U test. (C) iNKT cells were subgrouped according to the expression of CD4 and CD8 into CD4+, CD8+, double-negative (DN), and double-positive (DP) iNKT cells in HCV RNA–positive (n = 13) and HCV RNA–negative (n = 13) donors. (D and E) Percentage of iNKT cells positive for the indicated markers in HCV RNA–positive and –negative patients. Each bar represents results from 6–13 individual samples depending on sample availability and iNKT cell frequency. Groups were compared by unpaired t test. (C–E) Samples with iNKT frequency of less than 0.01% were excluded from phenotypical analysis. In box plots, horizontal bars indicate the medians, boxes indicate 25th to 75th percentiles, and whiskers indicate 10th and 90th percentiles.

