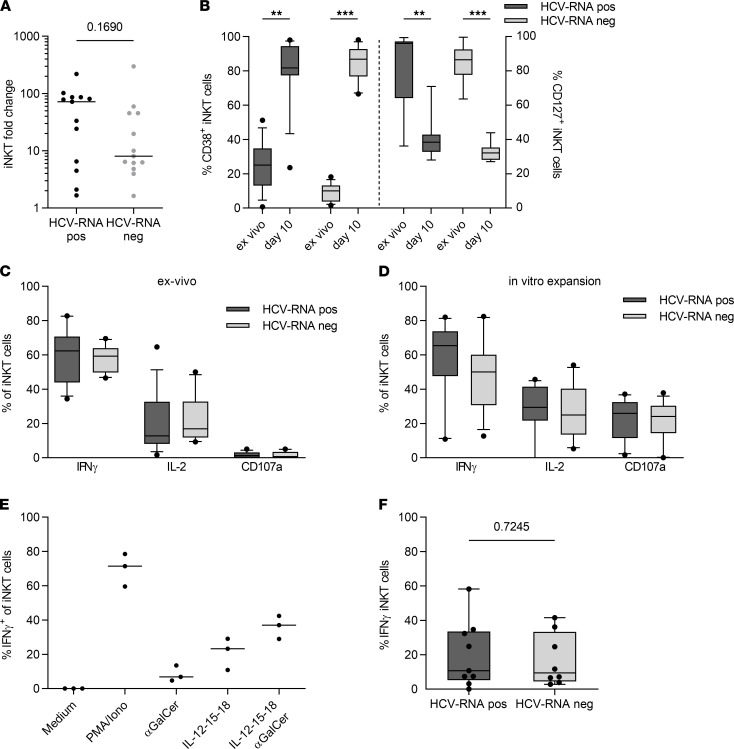
Figure 4. iNKT cell function does not differ between HCV RNA–positive and HCV RNA–negative PWID.
(A) PBMCs from HCV RNA–positive (n = 13) and HCV RNA–negative (n = 13) donors were stimulated in vitro for 10 days with α-galactosylceramide (αGalCer) and IL-2, and fold change of invariant NK T (iNKT) cell frequency was analyzed. Groups were compared by Mann-Whitney U test. (B) Frequency of CD38+ and CD127+ iNKT cells in HCV RNA–positive and –negative patients ex vivo and after 10 days of in vitro expansion with αGalCer and IL-2 (1-way ANOVA, **P ≤ 0.01, ***P ≤ 0.001). (C and D) PBMCs from HCV RNA–positive (n = 13) and HCV RNA–negative (n = 13) donors were stimulated in vitro with phorbol myristate acetate (PMA) and ionomycin for 5 hours in presence of brefeldin A (BFA) for the last 4 hours ex vivo (C) or after 10 days (D) of expansion with αGalCer and IL-2. Intracellular cytokine staining was performed for IFN-γ and IL-2 and degranulation was analyzed by staining of CD107a. (E) PBMCs from healthy donors were stimulated with PMA and ionomycin; αGalCer; a cocktail of IL-12, IL-15, and IL-18; or a combination of αGalCer, IL-12, IL-15, and IL-18 for 24 hours, and IFN-γ secretion was analyzed by intracellular cytokine staining (ICS). (F) PBMCs from HCV RNA–positive (n = 9) and HCV RNA–negative (n = 8) donors were stimulated with a combination of αGalCer and IL-12, IL-15, and IL-18 for 24 hours, with addition of BFA for the last 4 hours, and IFN-γ secretion was analyzed by ICS. Groups were compared by unpaired t test. In box plots, horizontal bars indicate the medians, boxes indicate 25th to 75th percentiles, and whiskers indicate 10th and 90th percentiles.

