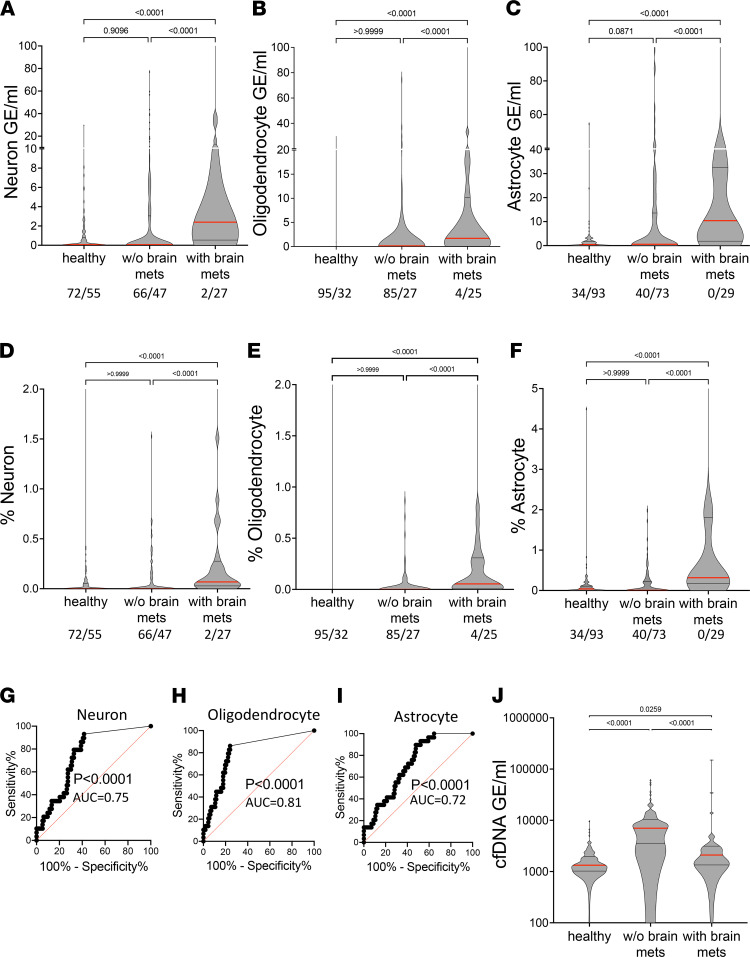
Figure 4. Plasma concentrations of brain-derived cfDNA.
(A–C) Brain cfDNA levels in healthy controls (n = 127), cancer patients (localized and non-brain-metastatic, n = 113), and cancer patients with metastases to the brain (n = 29). Shown are the average levels in plasma of 4 neuronal markers (A), 3 oligodendrocyte markers (B), and 3 astrocyte markers (C). Each dot represents 1 plasma sample. Numbers in the figure indicate samples with 0/above 0 cfDNA molecules with a brain-derived signature. Statistical significance was measured by Kruskal-Wallis test with Dunn’s post hoc correction for multiple comparisons. (D–F) Brain cfDNA levels as in A–C, expressed as percentage of cfDNA derived from the indicated brain cell type. Statistical significance was measured by Kruskal-Wallis test with Dunn’s post hoc correction for multiple comparisons. (G–I) ROC curve for the diagnosis of brain collateral damage in plasma of cancer patients with brain metastasis compared to cancer patients without brain metastases. (G) Neuronal markers; AUC 0.75, 95% CI = 0.66 to 0.84; P < 0.0001. (H) Oligodendrocyte markers; AUC 0.81; 95% CI = 0.72 to 0.89; P < 0.0001. (I) Astrocyte markers; AUC 0.72, 95% CI = 0.63 to 0.81; P < 0.0001. (J) Plasma concentrations of total cfDNA in the same donors as in A–C. Statistical significance was measured by Kruskal-Wallis test with Dunn’s post hoc correction for multiple comparisons.

