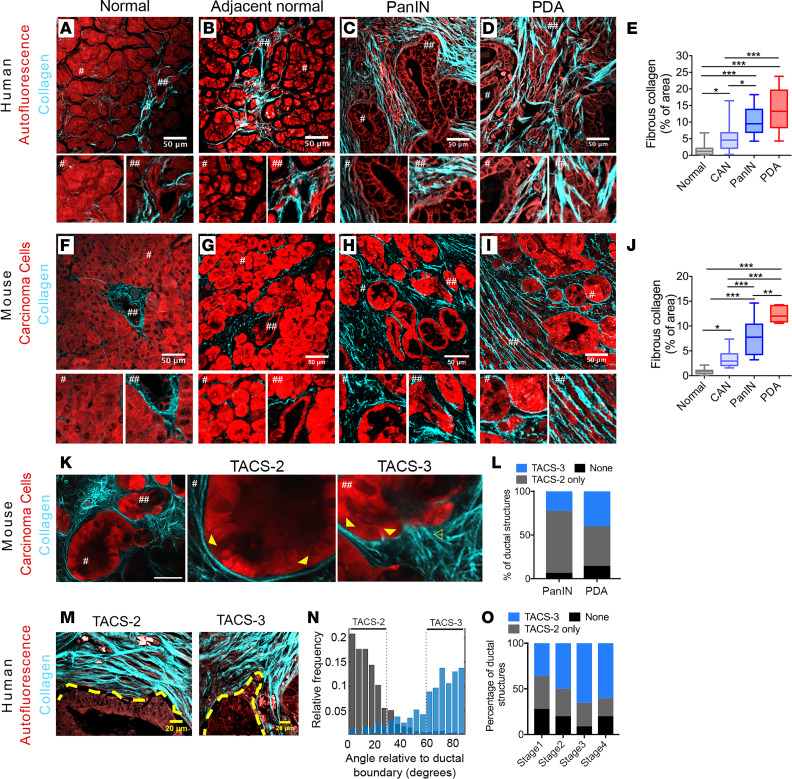
Figure 1. Fibrous collagen architectures in PDA.
(A–D) Combined MPE and SHG imaging of patient samples showing tissue architecture by autofluorescence and fibrous collagen by SHG in (A) normal, (B) cancer-adjacent normal, (C) PanIN, and (D) mature PDA (# and ##, 2× magnifications of the indicated regions) and related (E) collagen quantification (n = 10–21 fields of view [FOV] across n ≥ 3 patient samples per group). (F–I) Combined MPE/SHG imaging and analysis using KPCT or KPCG mouse models of PDA for (F) normal, (G) cancer-adjacent normal, (H) PanIN, and (I) well-differentiated PDA and related (J) collagen quantification (n = 5–12 FOV across n ≥ 3 mice per group). (K) Typical collagen architectures in early disease (1.5-month KPCT mouse) (# and ##, 3× magnifications of the indicated regions; outlined and solid arrowhead, TACS-3 and TACS-2, respectively). (L) Frequency of quantified TACS (per duct) associated with PanIN and well-differentiated PDA in KPCT/KPCG mice (n > 20 FOV across ≥ 6 mouse tumors/group; by 2-way ANOVA, P < 0.0001 for TACS type and ns for PanIN/PDA as main effects; ns for association of each of None, TACS-2 only, and TACS-3 with PanIN versus PDA by Tukey’s multiple-comparison test). (M and N) Representative TACS-2+ and TACS-3+ ducts in well-differentiated human PDA, with yellow dashed lines indicating ductal boundaries (M), quantified by CT-FIRE (60) (N). (O) Frequency of TACS-2 and TACS-3 associated with ductal structures from different stages of human disease (n = 10–33 FOV across n ≥ 3 patient samples; P = 0.15 and P = 0.41 by Fisher’s exact test for the association of stage with None versus TACS and TACS-2 only versus TACS-3, respectively). Scale bars: 50 μm (A–D, F–I, and K) and 20 μm (M); box-and-whisker plots show minimum to maximum with median and interquartile range for E and J; *P < 0.05, **P < 0.01, ***P < 0.001 by the nonparametric Kruskal-Wallis test and Dunn’s multiple-comparison test.

