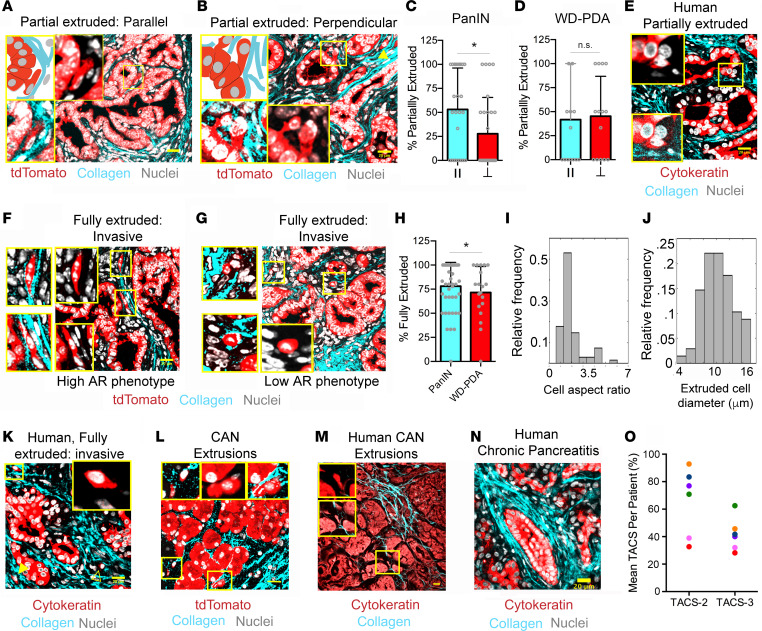
Figure 2. PDA cell extrusion into periductal collagen architectures.
(A and B) Schematic (top left boxes) and micrographs of partial extrusion of carcinoma cells in KPCT/KPCG tumor sections into (A) TACS-2 and (B) TACS-3 in the periductal stroma. Magnified images (yellow boxes) show either all channels (bottom left) or without SHG (insets). Yellow arrowhead (B) points to another fully extruded, aligned cell. (C and D) Frequency of partial cell extrusion in (C) PanIN and (D) well-differentiated PDA (WD-PDA) associated with parallel TACS-2 (II) or perpendicular TACS-3; data are mean ± SD; n = 27 (C) and 14 (D) FOVs; *P < 0.05 by Mann-Whitney U test. (E) Partial extrusion in human well-differentiated (WD) PDA samples. Magnified images (yellow box) show either all channels (bottom inset) or without SHG (top inset). (F–H) Typical fully extruded carcinoma cells (F and G) in PanIN and well-differentiated PDA and (H) their frequency among all extrusions; data are mean ± SD, n = 45 (PanIN) and 14 (WD-PDA); *P < 0.05 by Mann-Whitney U test. Magnified images (yellow boxes) are shown without SHG (insets) or with all channels (left). (I and J) Histogram of (I) aspect ratios and (J) diameters of fully extruded cells in mice; n = 68 cells across 12 mouse tumors. (K) Fully extruded periductal cells in human WD- PDA samples; Insets show magnified yellow box region, shown without the SHG channel; solid yellow arrowhead (K) points to another aligned, fully extruded cell, and outlined yellow arrowhead points to a rounded, nonaligned cell. (L and M) Cancer-adjacent “normal” regions from KPC mice or humans. Insets show magnified images of extruded cells marked with yellow boxes, with all channels or without SHG. (N) Collagen architecture surrounding ducts in human chronic pancreatitis (CP). (O) Frequency of TACS-2 and TACS-3 in association with ductal structures in human CP (n = 8–33 fields of view from 6 patient samples). Scale bars: 20 μm.

