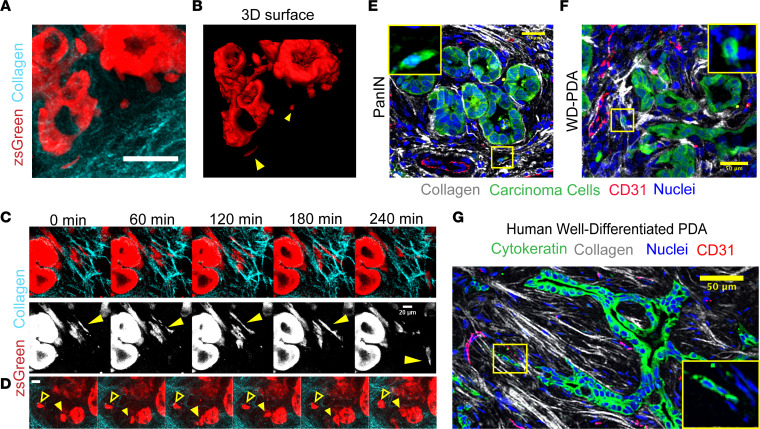
Figure 3. Live imaging reveals dynamics of cell extrusion and invasion in early stage disease.
(A and B) Live 3D imaging of PanIN lesions in a KPCG mouse showing extruded cells invading through organized collagen in the periductal space by (A) a maximum intensity projection of ~100 μm depth and (B) 3D surface rendering of the same region demonstrating that the extruded cells observed in tissue slices were not attached to the main duct at other panels; yellow arrowheads point to extruded cells — see also Supplemental Video 1. (C) Time-lapse montage from tracking single, aligned cells in periductal collagen by live MPE/SHG imaging of a KPCG tumor; yellow arrowhead indicates cell of interest that migrates rapidly along a collagen fiber (see also Supplemental Video 4). (D) Time-lapse montage showing the dynamics of a partially and fully extruded cell in the same field of view in a KPCG tumor; yellow solid arrowhead points to a partially extruded cell, still connected to the underlying ductal structure, and yellow outline arrowhead points to a fully extruded cell in the stroma (see also Supplemental Video 5). (E and F) Immunofluorescence micrograph of KPCT tumor sections stained with RFP (shown in green), CD31 (red), and DRAQ5 (blue), demonstrating single extruded cells interacting with aligned periductal collagen (white) directed to blood vessels in (E) PanIN lesions and (F) well-differentiated PDA; inset shows magnified region (yellow box) displaying the fluorescent reporter and nuclei channels. (G) Fluorescence micrograph of human PDA stained with CD31 (red), DRAQ5 (blue), and cytokeratin (green) showing aligned extruded cells following collagen tracks (white) leading to a blood vessel; inset shows magnified region (yellow box) displaying only the fluorescent reporter and nuclei channels. Scale bars: 20 μm (C and D) and 50 μm (A, B, and E–G).

