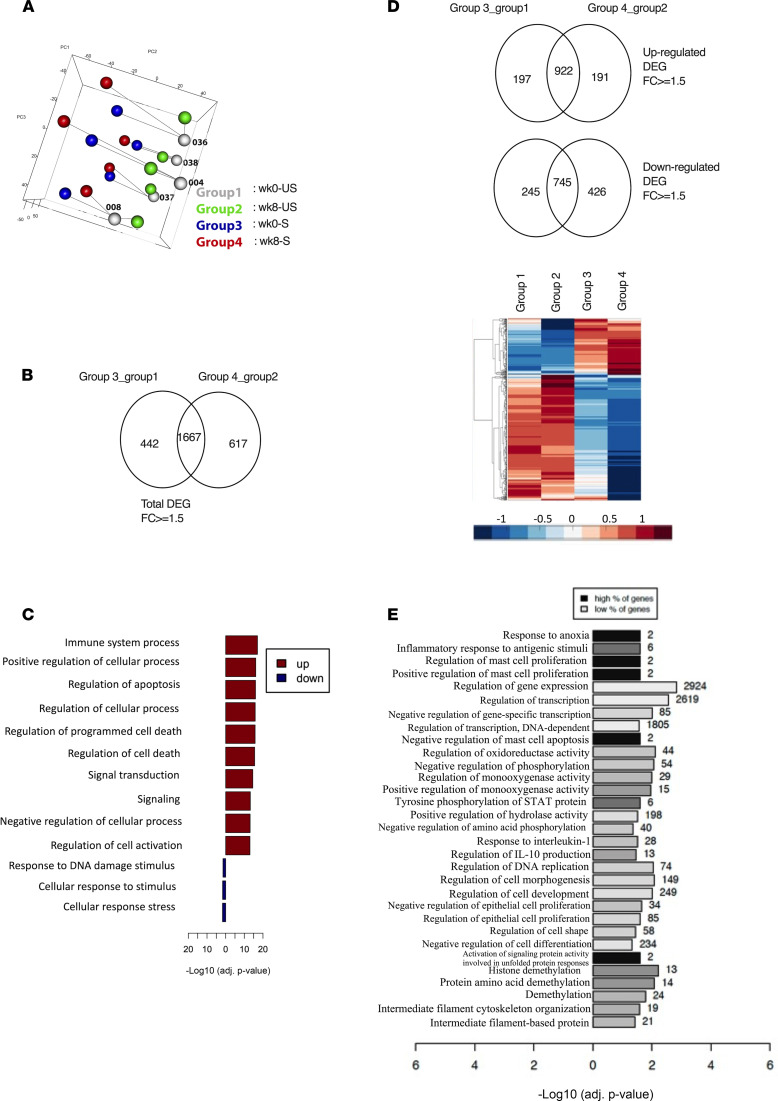
Figure 5. Transcriptomic analysis of alveolar macrophages (AM) following LD aerosol vaccination.
(A) Principal component analysis (PCA) of gene expression in AM obtained before (wk0) and after (wk8) LD aerosol vaccination cultured with (S) or without (US) stimulation. (B) Venn diagram comparing all DEGs in pairwise comparison. (C) Significantly enriched functional categories of biological processes by GO associated with DEGs shared between the baseline (wk0) Group 3/1 and aerosol vaccine (wk8) Group 4/2. (D) Venn diagram comparing up- and downregulated DEGs in pairwise comparison. Heatmap shows DEG uniquely up- and downregulated, in stimulated aerosol (Group 4) AM. (E) Significantly enriched functional categories of biological processes by GO associated with uniquely upregulated DEGs in stimulated aerosol (Group 4) AM. Statistical differences in functional categories of biological processes was performed using BINGO plugin, which uses a hypergeometric test with Benjamini-Hochberg FDR correction.

