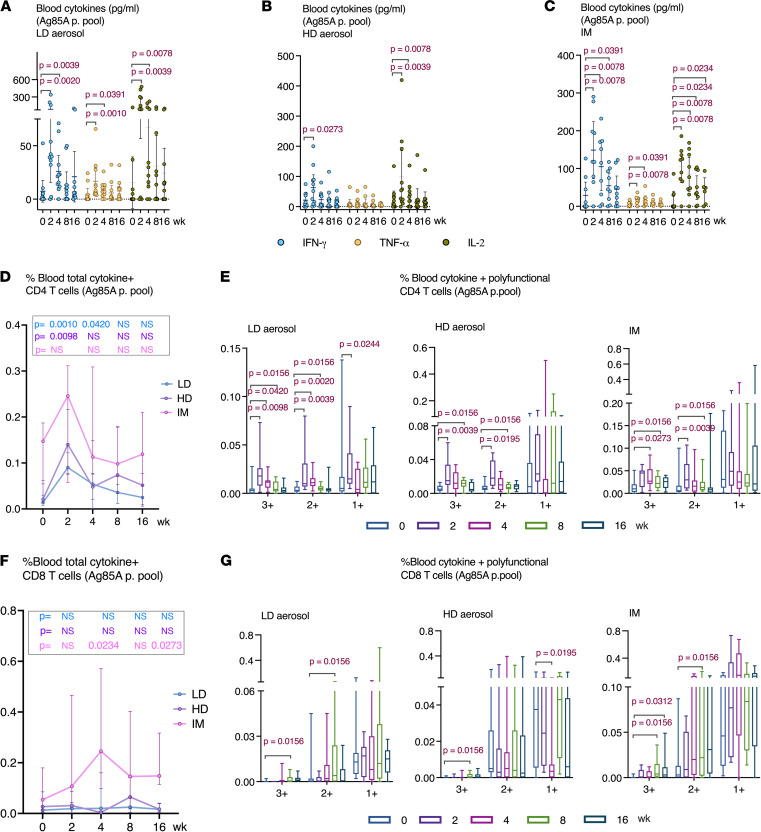
Figure 6. Induction of antigen-specific T cell responses in the peripheral blood following aerosol or intramuscular vaccination.
(A–C) Antigen-specific cytokine production in whole blood culture at various time points after LD aerosol, HD aerosol, and i.m. vaccine groups. The measurements were subtracted from unstimulated control values. (D) Frequencies of peripheral blood antigen–specific combined total-cytokine-producing CD4+ T cells at various time points in LD aerosol, HD aerosol, and i.m. cohorts. (E) Frequencies of peripheral blood polyfunctional (triple/3+, double/2+, and single/1+ cytokine+) antigen-specific CD4+ T cells at various time points in LD aerosol, HD aerosol, and i.m. vaccine groups. (F) Frequencies of peripheral blood antigen–specific combined total-cytokine–producing CD8+ T cells at various time points in LD aerosol, HD aerosol, and i.m. groups. (G) Frequencies of peripheral blood polyfunctional (triple/3+, double/2+ and single/1+ cytokine+) antigen-specific CD8+ T cells at various time points in LD aerosol, HD aerosol, and i.m. groups. Data in dot plots are expressed as the mean value (horizontal line) with 95% CI. Box plots show mean value (horizontal line) with 95% CI (whiskers), and boxes extend from the 25th to 75th percentiles. Line graphs show median with IQR. Wilcoxon matched pairs signed-rank test (A, B, E, and G) was used to compare various time points with baseline values within the same vaccination group. Mann-Whitney U test (D and F) was used when comparing vaccination groups.

