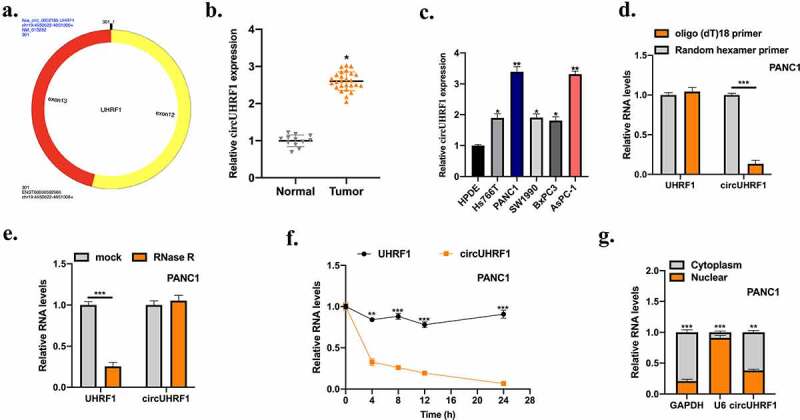
Figure 1.

Expression of circUHRF1 in PDAC. a: The diagram information of circUHRF1 was shown. b: Measurement of circUHRF1 expression in adjacent normal tissues (n = 12) and PDAC tissues (n = 26) was examined by qRT-PCR. c: Measurement of circUHRF1 expression in PDAC cell lines (AsPC-1, PANC1, SW1990, BxPC3, and Hs766T) in comparison with pancreatic epithelial cell line HPDE was detected using qRT-PCR. d: Random hexamer or oligo (dT)18 primers were used for reverse transcription assays. RT-qPCR was used to examine the relative RNA levels. e: After treatment with actinomycin d at the indicated time points in PANC1 cells, RT-PCR was conducted to measure the relative RNA levels. f: After treatment with RNase R or mock in total RNAs derived from PANC1 cells. Relative RNA levels were examined by RT-qPCR. g: Relative expression of circUHRF1 in nuclear and cytoplasm. All experiments were performed three times, and data were presented as mean ± SD. *p < 0.05, **p < 0.05, ***p < 0.001.
