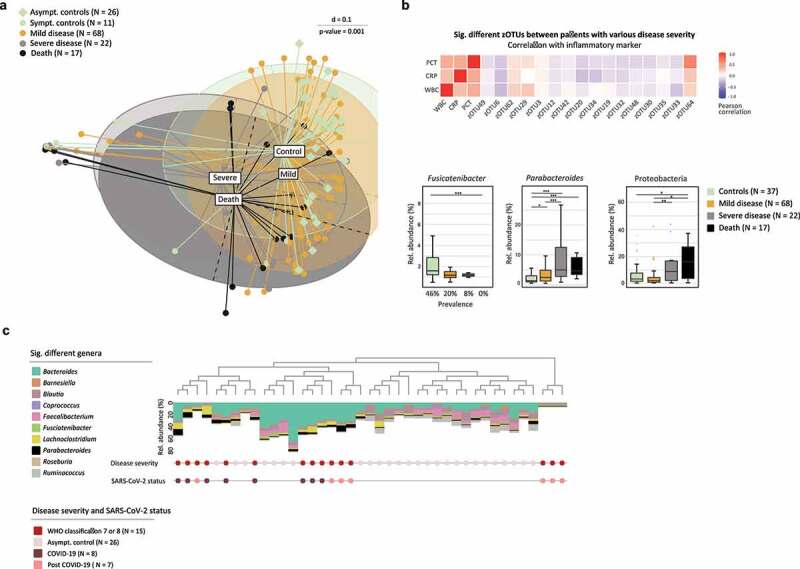
Figure 2.

Microbial Profile of the Gut is Associated with Disease Severity.
A Heatmap shows significant different taxa between COVID-19, post COVID-19 and SC patients (while correcting for the confounders antibiotic intake, feeding, and ward) with a different disease severity in correlation to inflammatory biomarkers (T1). B WBC, CRP and PCT. Boxplots show significantly different taxa according to disease severity. Fusicatenibacter shows differences in prevalence (p-value = 0.02), the genus Parabacteroides and phylum Protobacteria are significantly different in their relative abundance (p-value ≤ 0.001) (T1). C Dendrogram shows generalized UniFrac distances between a subset of COVID-19 and post COVID-19 patients, fulfilling certain criteria of a high inflammatory and severe disease, and AC for the sampling at T1. Stacked barplots display the relative abundance values of bacteria most significantly different. Confounding factors (antibiotic intake, feeding, and ward) have been taken into account.
