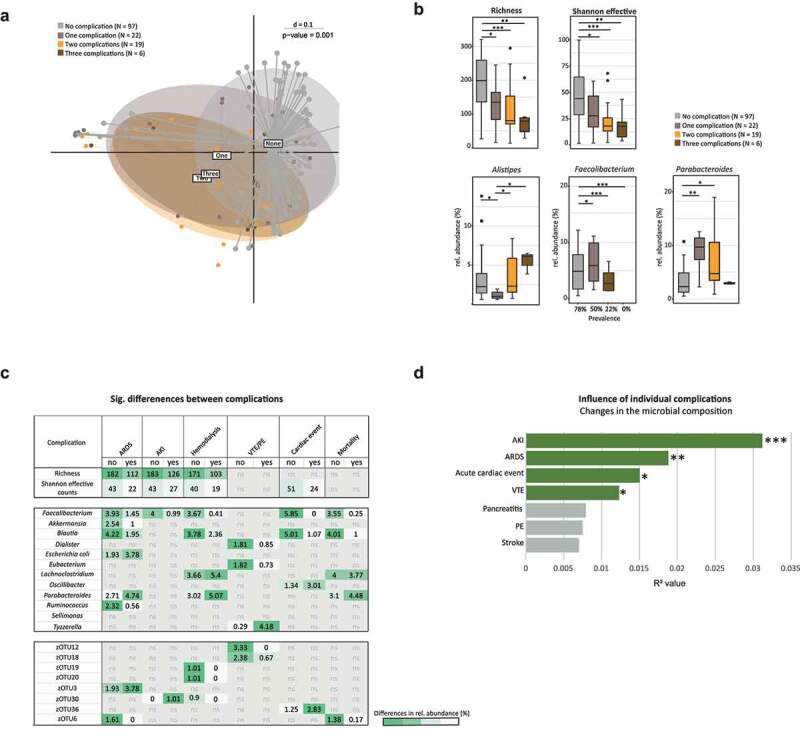
Figure 3.

Association Between Gut Bacterial Composition and Common Complications.
A MDS plot calculated on generalized UniFrac distance stratifying COVID-19 and post COVID-19 patients, SC and AC (T1) according to the number of complications during hospitalization. B Same samples (T1) as in panel A, boxplots show significant differences in alpha-diversity and relative abundance of taxa. Faecalibacterium shows differences in prevalence (p-value = 0.0002) and relative abundance (p-value ≤ 0.01), Parabacteroides and Alistipes are significantly different in their relative abundance (p-value ≤ 0.01). C Heatmap with taxa found to be significantly different COVID-19, post COVID-19 and SC patients (T1) and with specific complications. Values are showing the mean relative abundance detected in patients with the complication compared to patients without complication. The color code indicates high (green) or low (white) relative abundance. D Multivariate permutational analysis revealed the importance of complications regarding microbial composition (T1). Barplots are showing the R2 values. Green bars = significant variables (*, p ≤ .05, **, p ≤ .01; ***, p ≤ .001), gray = non-significant variables. The same T1 samples are shown in panel A, B and C.
