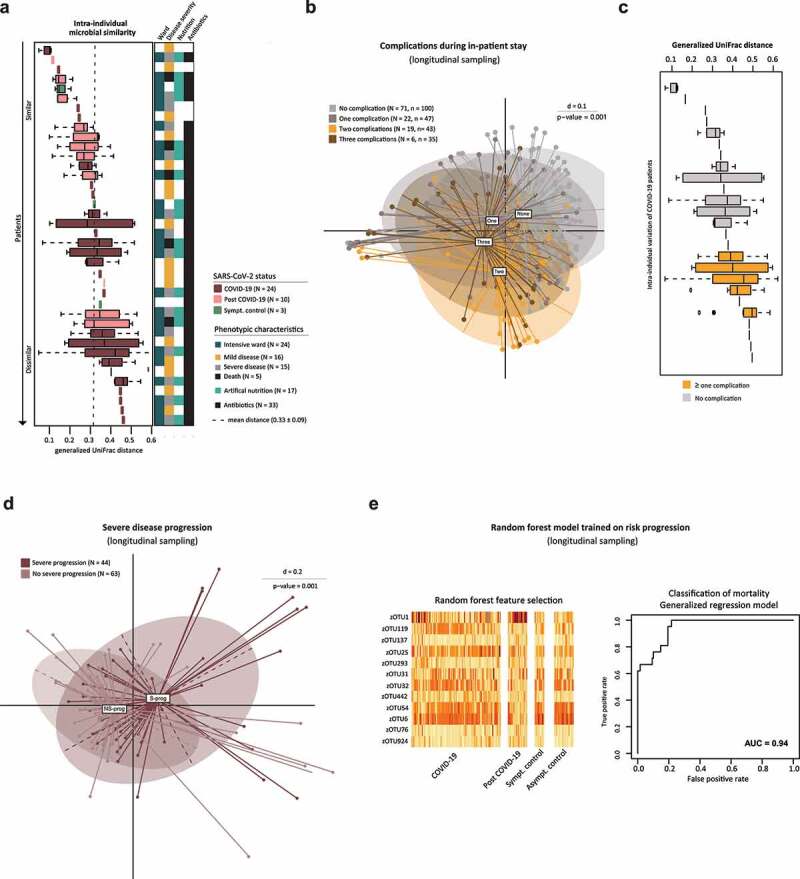
Figure 4.

Stability of the Bacterial Composition Related to COVID-19 and Longitudinal Analysis.
A Intra-individual generalized UniFrac distance sorted by median distance within one patient. Longitudinal sampling of at least two samples per patient with a medium of 3.5 (COVID-19), 4.6 (post COVID-19), and 2.3 (SC) samples per patient (all T). Each box represents one patient. Dashed line shows the mean intra-individual distance over all patients (N = 39). Right color bar shows variables related to hospitalization as indicated by the legend. B MDS plot calculated on generalized UniFrac distances stratifying COVID-19, post COVID-19 and SC patients (all T) according to number of complications. C Intra-individual generalized UniFrac distances sorted by median distance within one patient of the COVID-19 cohort with a minimum of two samples (N = 25). Each box represents one patient. D MDS plot calculated on generalized UniFrac distance stratifying COVID-19 and post COVID-19 patients (all T) for disease progression in severe (S-prog) compared to patients not meeting these criteria (NS-prog). E Individual relative abundance values of random forest selected zOTUs for classification of severe disease progression grouped by SARS-CoV-2 status. ROC curve shows differentiation by mortality based on previously determined feature list.
