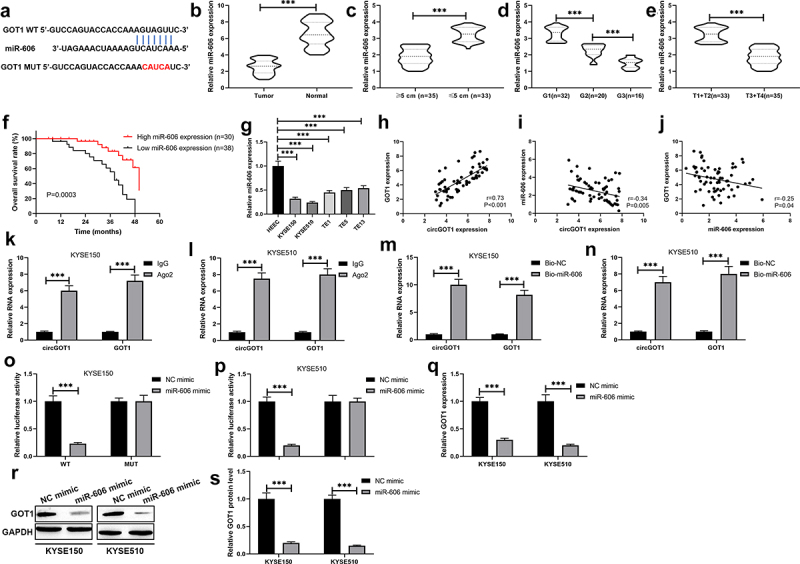
Figure 6.

CircGOT1 promoted GOT1 expression via sponging miR-606. (a). The binding sites of miR-606 at 3ʹUTR of GOT1 were precited using Targetscan (http://www.targetscan.org/vert_72/) online software. (b-e). The qPCR analysis was used to determine the expression of miR-606 in 68 ESCC tissues and matched normal tissues with different size (≥5 cm, n = 35; ≤5 cm, n = 33), tumor grades (G1, n = 32; G2, n = 20; G3, n = 16) and pathological stages (T1+ T2, n = 33; T3+ T4, n = 35). (f). The Kaplan-Meier survival curve analysis reveals the high and low expression of miR-606 associated overall survival. (g-i). Association between the expression of circGOT1 and GOT1, circGOT1 and miR-606, miR-606 and GOT1 was determined by Pearson’s correlation analysis. (j). The qPCR analysis was used to analyze the expression of miR-606 in WSCC cell lines (KYSE150, KYSE510, TE1, TE5, and TE13) and HEEC. K-L. RIP assay was used to demonstrate the enrichment by circGOT1 and GOT1 in anti-Ago2 antibody instead of anti-IgG antibody. M-N. RNA-pulldown assay was used to immune-precipitate circGOT1 and GOT1. (o-p). Dual-luciferase activity assay was used to demonstrate miR-606 directly binds with GOT1. (q). The qPCR analysis was used to detect the expression of GOT1 after miR-606 upregulation. (r-s). The Western blotting was used to examine the protein levels of GOT1 after miR-606 upregulation. ***P < 0.001.
