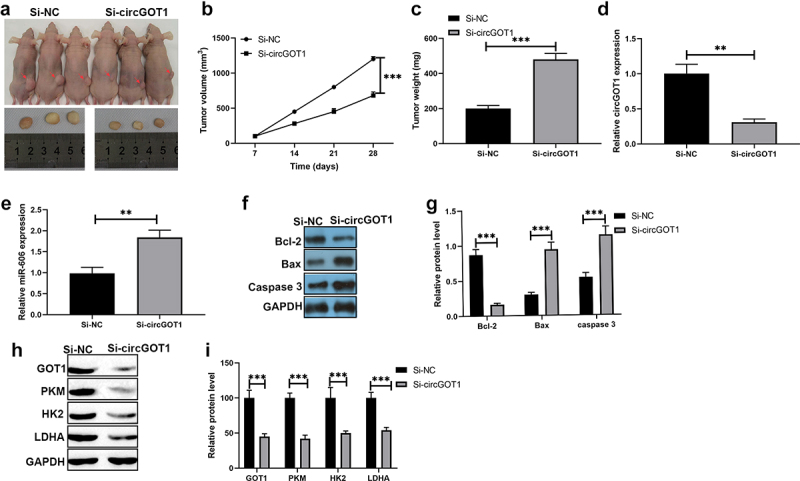
Figure 8.

Silence of circGOT1 repressed tumor growth in vivo. (a-c). Tumor separated from mice and the size was measured by tumor weight and tumor volume. (d). The qPCR was used to determine the expression of E-cadherin, N-cadherin, and Vimentin after circGOT1 knockdown. (e). The qPCR was used to detect the expression of Bcl-2, Bax, caspase 3 after circGOT1 inhibition. (f-g). The Western blotting was used to examine the protein levels of GOT1, PKM, HK2, and LDHA after circGOT1 inhibition. ***P < 0.001.
