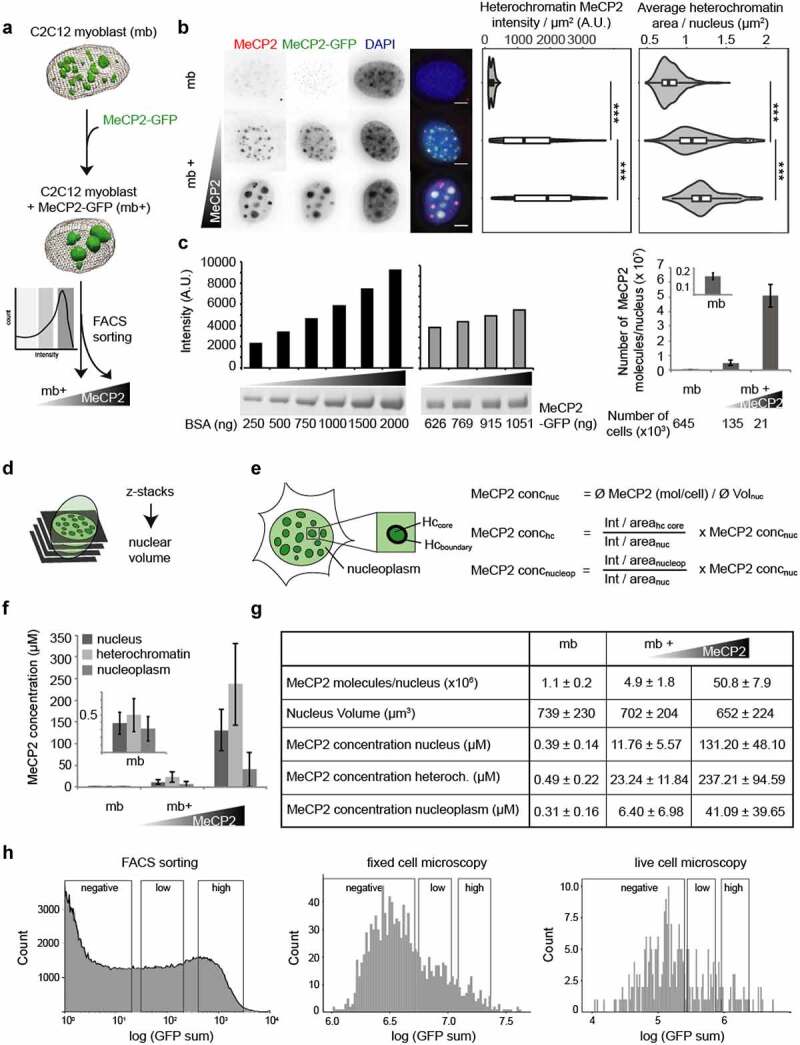
Figure 3.

Validation and calibration of a cellular system mimicking in vivo MeCP2 physiological behavior.
(A) Scheme of the experiment: C2C12 myoblast (mb-) were transfected with a plasmid encoding for MeCP2-GFP. After 20 h, transfected cells (mb+) were sorted into two categories, low and high expressing, according to the GFP intensity using a Fluorescence-activated cell sorting (FACS).(B) Immunofluorescence staining showing MeCP2 levels in mouse myoblasts before and after transfection of MeCP2-GFP. Scale bars = 5 µm. Boxplots show the MeCP2 heterochromatin mean intensity and the mean heterochromatin cluster area of untransfected, low and high MeCP2 expressing myoblasts of three independent replicates (***p < 0.001, Wilcoxon test).(C) Quantification of total MeCP2 in mouse myoblasts. The concentration of MeCP2-GFP standard was determined by SDS-PAGE and coomassie staining in comparison to a BSA standard series. The MeCP2 standard was used to quantify the MeCP2 protein level in untransfected, low and high expressing FACS sorted mouse myoblasts by Western blot against MeCP2 for three independent replicates (average values ± standard deviation). Full gels and Blots are shown in Fig. S3.(D) Scheme of the calculation of the nuclear volume based on thresholded 0.2 µm z-stacks.(E) Scheme of the cell segmentation and the calculations of the MeCP2 concentration in the nucleus and its subcompartments heterochromatin and nucleoplasm. Nucleus concentration (concnuc) was obtained from total protein amount from Western blot divided by nucleus area, subcompartment concentration (conchc or concnucleop) were calculated from the intensity ratios between the correspondent subcompartments (for conchc, we used the core region, nucleoplasm for concnucleop) versus nucleus and nucleus concentration.(F) Average MeCP2 concentrations in the nucleus and its subcompartments heterochromatin and nucleoplasm in untransfected, low and high expressing mouse myoblasts (average ± standard deviation).(G) Table showing the results of total MeCP2 quantification (as average ± standard deviation) in untransfected, low and high transfected myoblasts. Calculated values of number of molecules, nucleus volume (µm3) and MeCP2 concentration (µM) for each condition. Low mb+ present similar number of molecules to those calculated in mouse brain cells ([83]).(H) Instrument-independent calibration of the quantification of MeCP2. To allow comparison of intensities between instruments, we classified the cells using a population curve after transfection plotting counts versus log of the GFP intensity, considering three windows: negative, defined from the measurements obtained from untransfected cells, and then dividing the positively transfected cells in 29 bins, in which 2–10 correspond to low MeCP2 levels and 13–21 to high MeCP2 levels.
