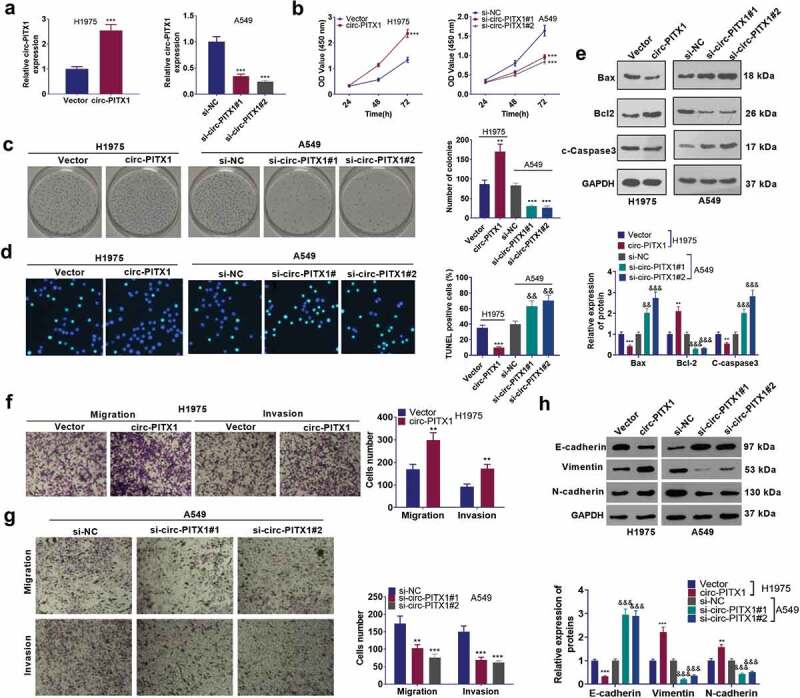
Figure 2.

The influence of circ-PITX1 on the malignant phenotypes of NSCLC cells. (a) H1975 and A549 cell lines were taken for the construction of the circ-PITX1 overexpression and down-regulation cell models. B and C. CCK-8 (b) and colony formation assay (c) examined cell proliferation, NS P > 0.05, **P < 0.01 ***P < 0.001 vs. the vector group or the si-vector group. (d) TUNELgauged cell apoptosis. (e) Western blot tested the expression of apoptosis-related proteins (Bax, Bcl-2, and c-Caspase3). f and g. Tranwell tracked cell migration (f) and invasion (g). (h) Western blot determined the protein levels of EMT markers (E-cadherin, Vimentin, and N-cadherin). **P < 0.01, ***P < 0.001 (vs.Vector group), &&P < 0.01, &&&P < 0.001 (vs.si-NC group). n = 3.
