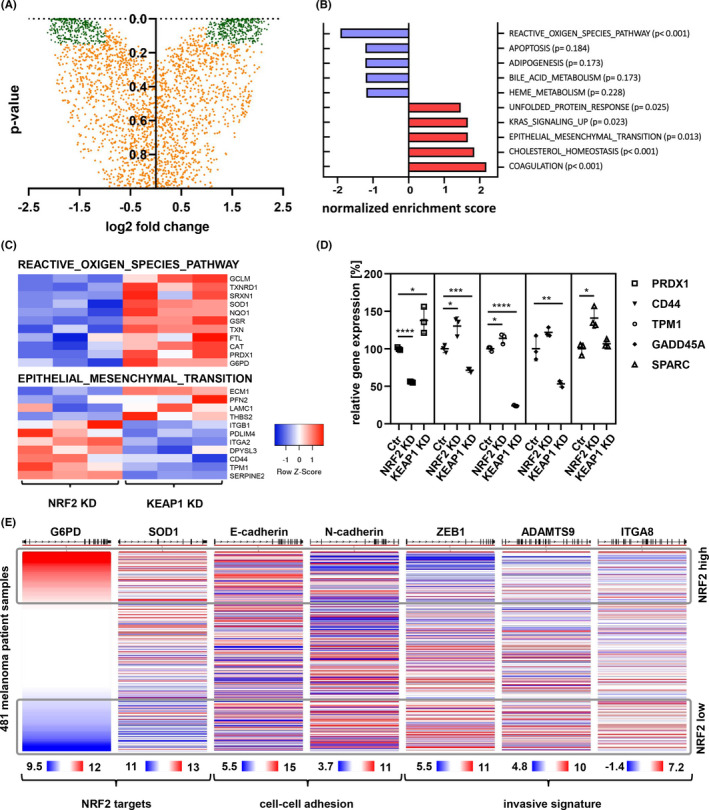
FIGURE 2.

Shotgun proteomics of NRF2 modulated cells showed up‐regulation of malignancy markers upon NRF2 inactivation. (A) Protein expression changes in NRF2 reduced state (NRF2 knockdown vs KEAP1 knockdown, 1205LU), proteins used for hallmark identification (716) in green, with log2 fold change above 1 or below −1 and p‐value below 0.15. (B) Most significantly regulated hallmarks in NRF2 reduced state (NRF2 knockdown vs KEAP1 knockdown, 1205LU) from proteome dataset. (C) Heatmap of protein abundance for members of the ROS and EMT gene set. (D) qPCR of 1205LU cDNA 24 h after siRNA transfection. PRDX1 is a NRF2 target. CD44, TPM1, GADD45A and SPARC are members of the EMT hallmark set (unpaired t‐test; *p‐value < 0.05; **p‐value < 0.01; ***p‐value < 0.001; ****p‐value < 0.0001). (E) Display of NRF2 target genes together with cell adhesion and invasion markers in the TCGA human skin cutaneous melanoma data set. Expression is shown as log2(norm_count+1)
