FIGURE 3.

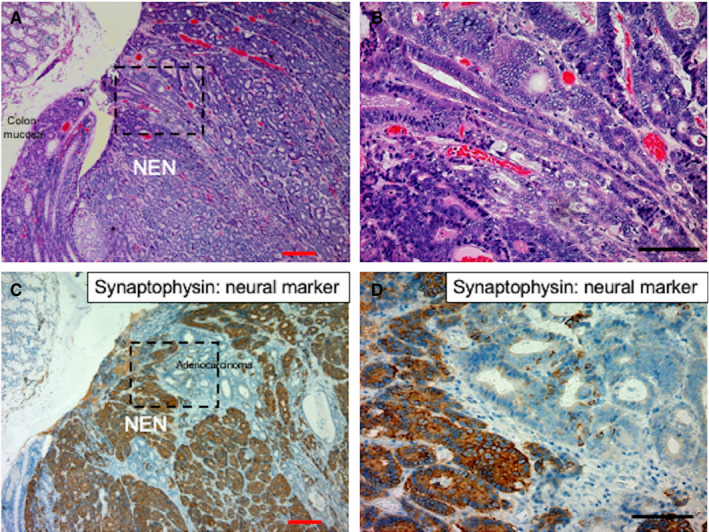
Histological distribution of NEN and adjacent colon adenocarcinoma in a representative colon NEN sample. (A) Low‐ and (B) high‐power view of the tumor distribution of NEN and colon adenocarcinoma in a resected colon NEN sample (case 1 in Table 3). (C) Low‐ and (D) high‐power view of the neural marker synaptophysin expression pattern of NEN and adjacent colon adenocarcinoma in a resected colon NEN sample. Red and black bars indicate 200 μm and 100 μm, respectively. NEN, neuroendocrine neoplasm
