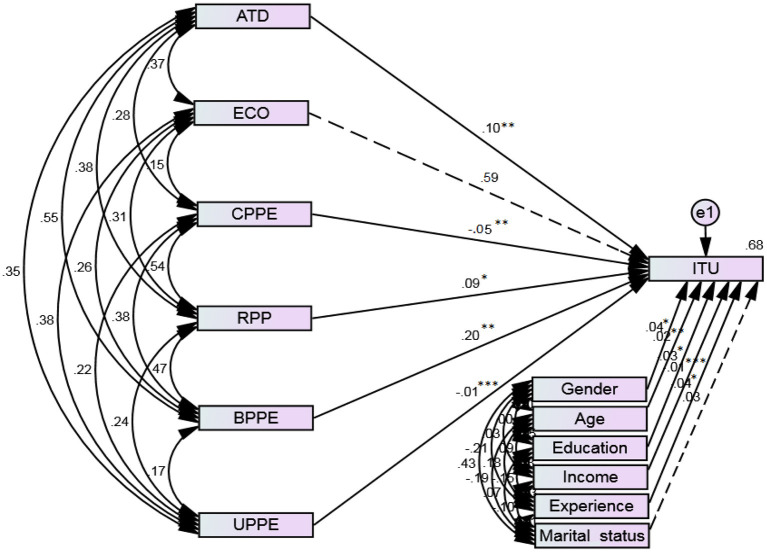
Figure 4.
Schematic depiction of SEM. Authors' calculation. ***p < 0.01, **p < 0.05, *p < 0.1. Significant values are indicated by continuous lines, whereas insignificant values are indicated by dashed lines. CFI = 0.990, NFI = 0.959, IFI = 0.991, TLI = 0.979, GFI = 0.981, RMSEA = 0.029, X2/df = 1.290. Authors' calculations.

