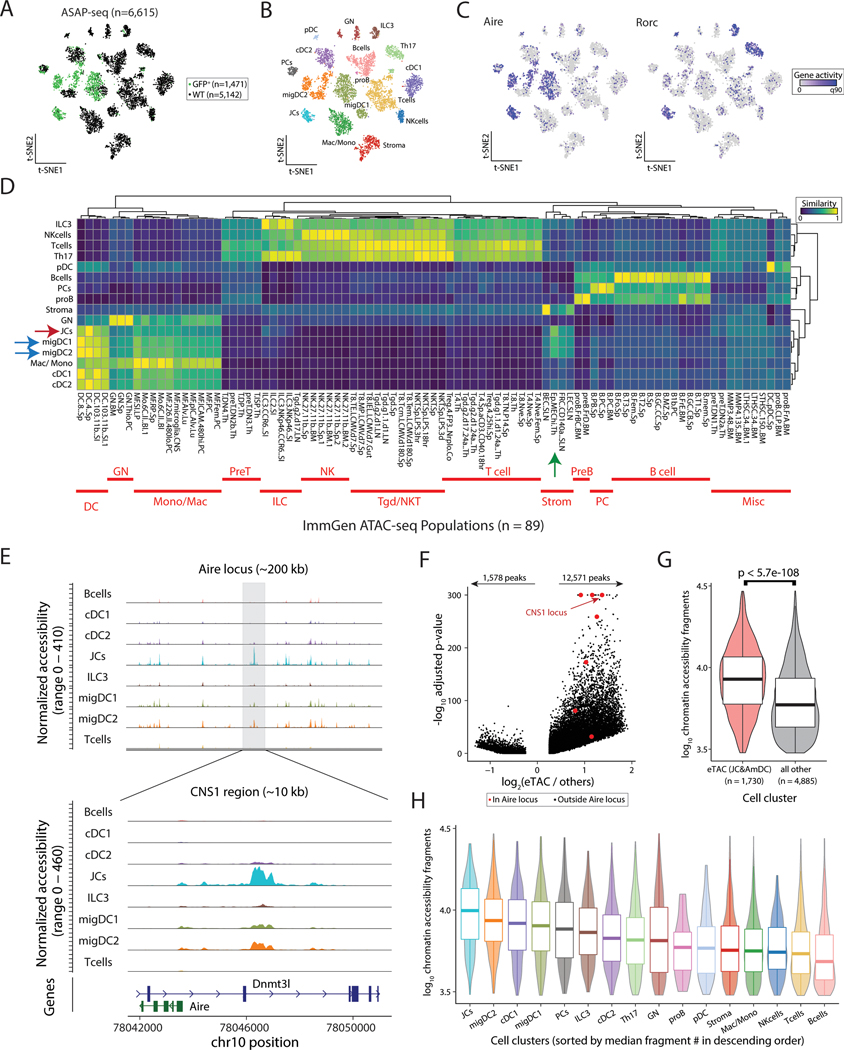
Figure 2. Single-cell-chromatin accessibility supports the genomic identity of eTACs as myeloid populations with uniquely accessible chromatin.
(A) Reduced dimensionality representation of ASAP-seq data, indicating the GFP and WT sample origins. (B) Annotated cell clusters of populations in ASAP-seq data. (C) Gene activity scores of Aire and Rorc across ASAP t-SNE. (D) Hierarchical clustering of pseudobulk ASAP-seq clusters by all ImmGen ATAC-seq data using a scaled cosine similarity metric. Rows min-max normalized. ImmGen populations cluster identities annotated in red as indicated. Aire-expressing populations are indicated with blue (migDC1/2) and red (JC) arrows, and mTECs from the ImmGen database with a green arrow. (E) Accessible chromatin landscape near the Aire locus, including the previously described CNS1 region (bottom). (F) Volcano plot of differential accessibility peaks, indicating the number of peaks with greater (n=12,571) or less (n=1,578) accessibility in Aire expressing populations. Aire locus peaks in large red dots; CNS1 locus as indicated. (G) Comparison of number of accessible chromatin fragments between eTACs and non-eTAC populations in the LN by box/violin overlay. Statistical test: Mann-Whitney test. (H) Per-cluster abundance of accessible chromatin fragments/cluster, box/violin overlay, noting highest accessibility in JCs. Boxplots: center line, median; box limits, first and third quartiles; whiskers, 1.5× interquartile range.

