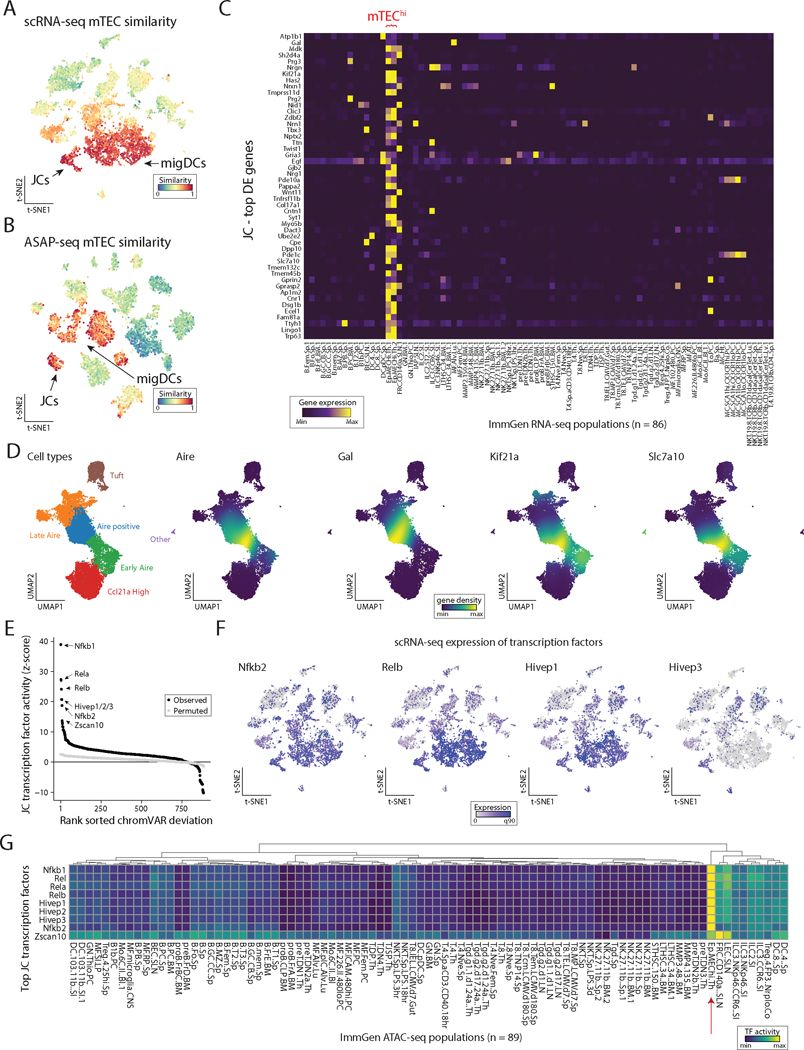
Figure 5. eTACs are defined by transcriptional and genomic homology to thymic medullary epithelium.
(A) ImmGen similarity scores for scRNA-seq and (B) ASAP-seq data for mTEC populations. JCs and migratory DCs clusters for each embedding are noted by arrow. (C) Heatmap of ImmGen bulk RNA-seq data for genes most overexpressed in JCs relative to all other lymph node populations. mTEChi populations indicated in red text on top. (D) UMAP of aggregated published scRNA data from thymic epithelium showing annotated TEC subsets (left) and gene-density expression for Aire and genes enriched in JCs (right). (E) Rank-ordering of transcription factor motifs enriched in JCs compared to other populations. (F) Expression of transcription factors from panel E in scRNA-seq data. (G) ImmGen bulk ATAC-seq chromVAR deviation scores for all 89 populations, highlighting the mTEC population with red arrow. Rows represent top transcription factors identified from JCs and are min-max normalized.

