
FIGURE 2.
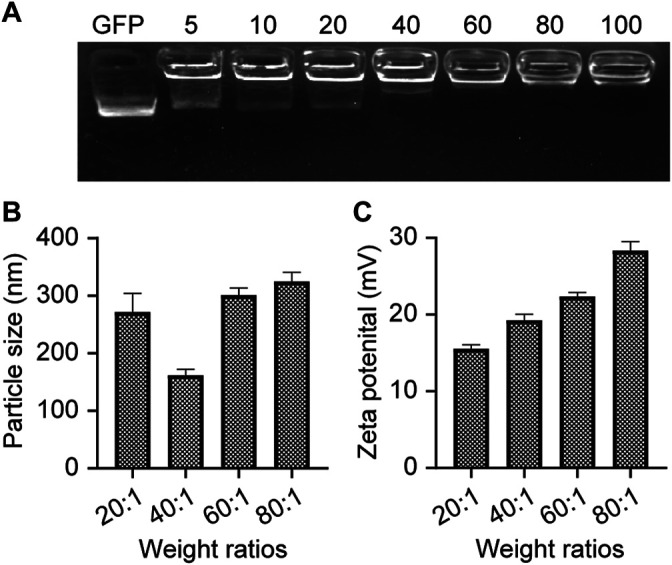
Characterization of NPs. (A) Agarose gel (2%) electrophoresis of NPs composed of PBAE537 and GFP at different mass ratios. (B) Measurement of particle sizes of NPs with different mass ratios (PBAE537:GFP) and (C) zeta potentials by dynamic light scattering. The data represent the mean ± SEM (n = 3 per group).