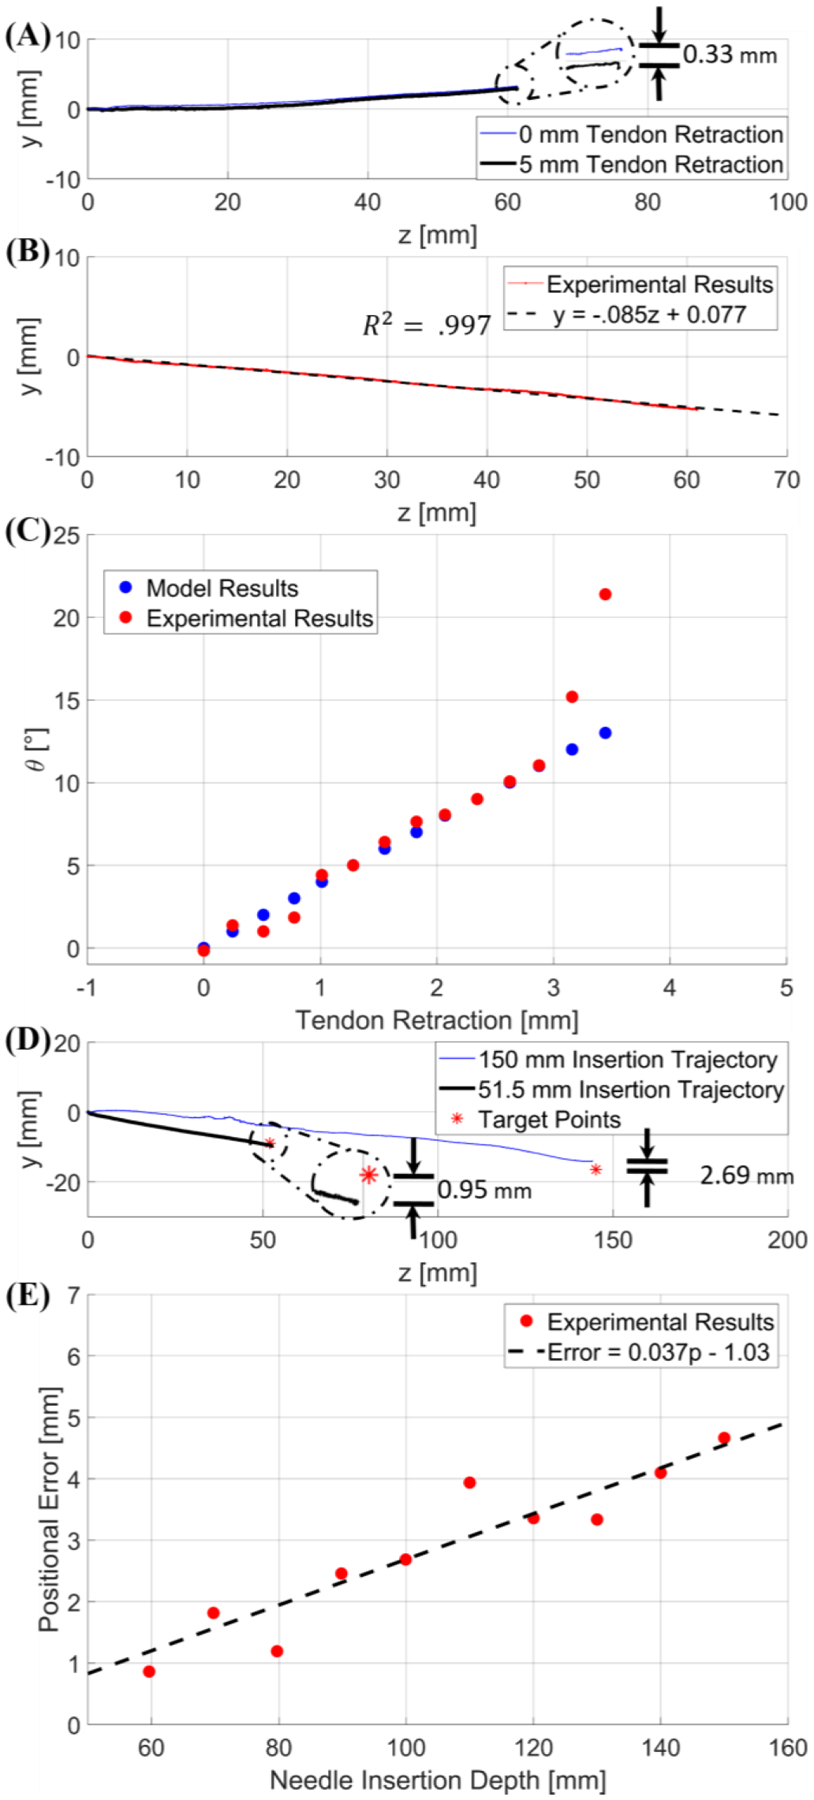
Fig. 10.

(A) is a graphical representation of the comparative study between a trajectory with 0 mm tendon retraction and a trajectory with 5 mm tendon retraction applied when the deflectable region is already inside the tissue. The error is depicted in the detailed view. (B) provides an example trajectory at a 5° user input, indicating a linear trajectory. (C) is a graph of the results from the second targeting test; blue represents the deflection angle vs. tendon retraction model per the modeling method in free space discussed in Section IV-A, and in red are the inclination angles of the experimental trajectories resulting from the corresponding tendon retraction. (D) provides two different trajectories within the porcine tissue with respect to their desired target locations (red asterisk). The 150 mm trajectory was obtained with initial deflection angle of 6.41° (blue line), and the 51.50 mm trajectory was obtained with initial deflection angle of 9.28° (black line). (E) is a graphical relationship between positional error and insertion depth within the porcine sample.
