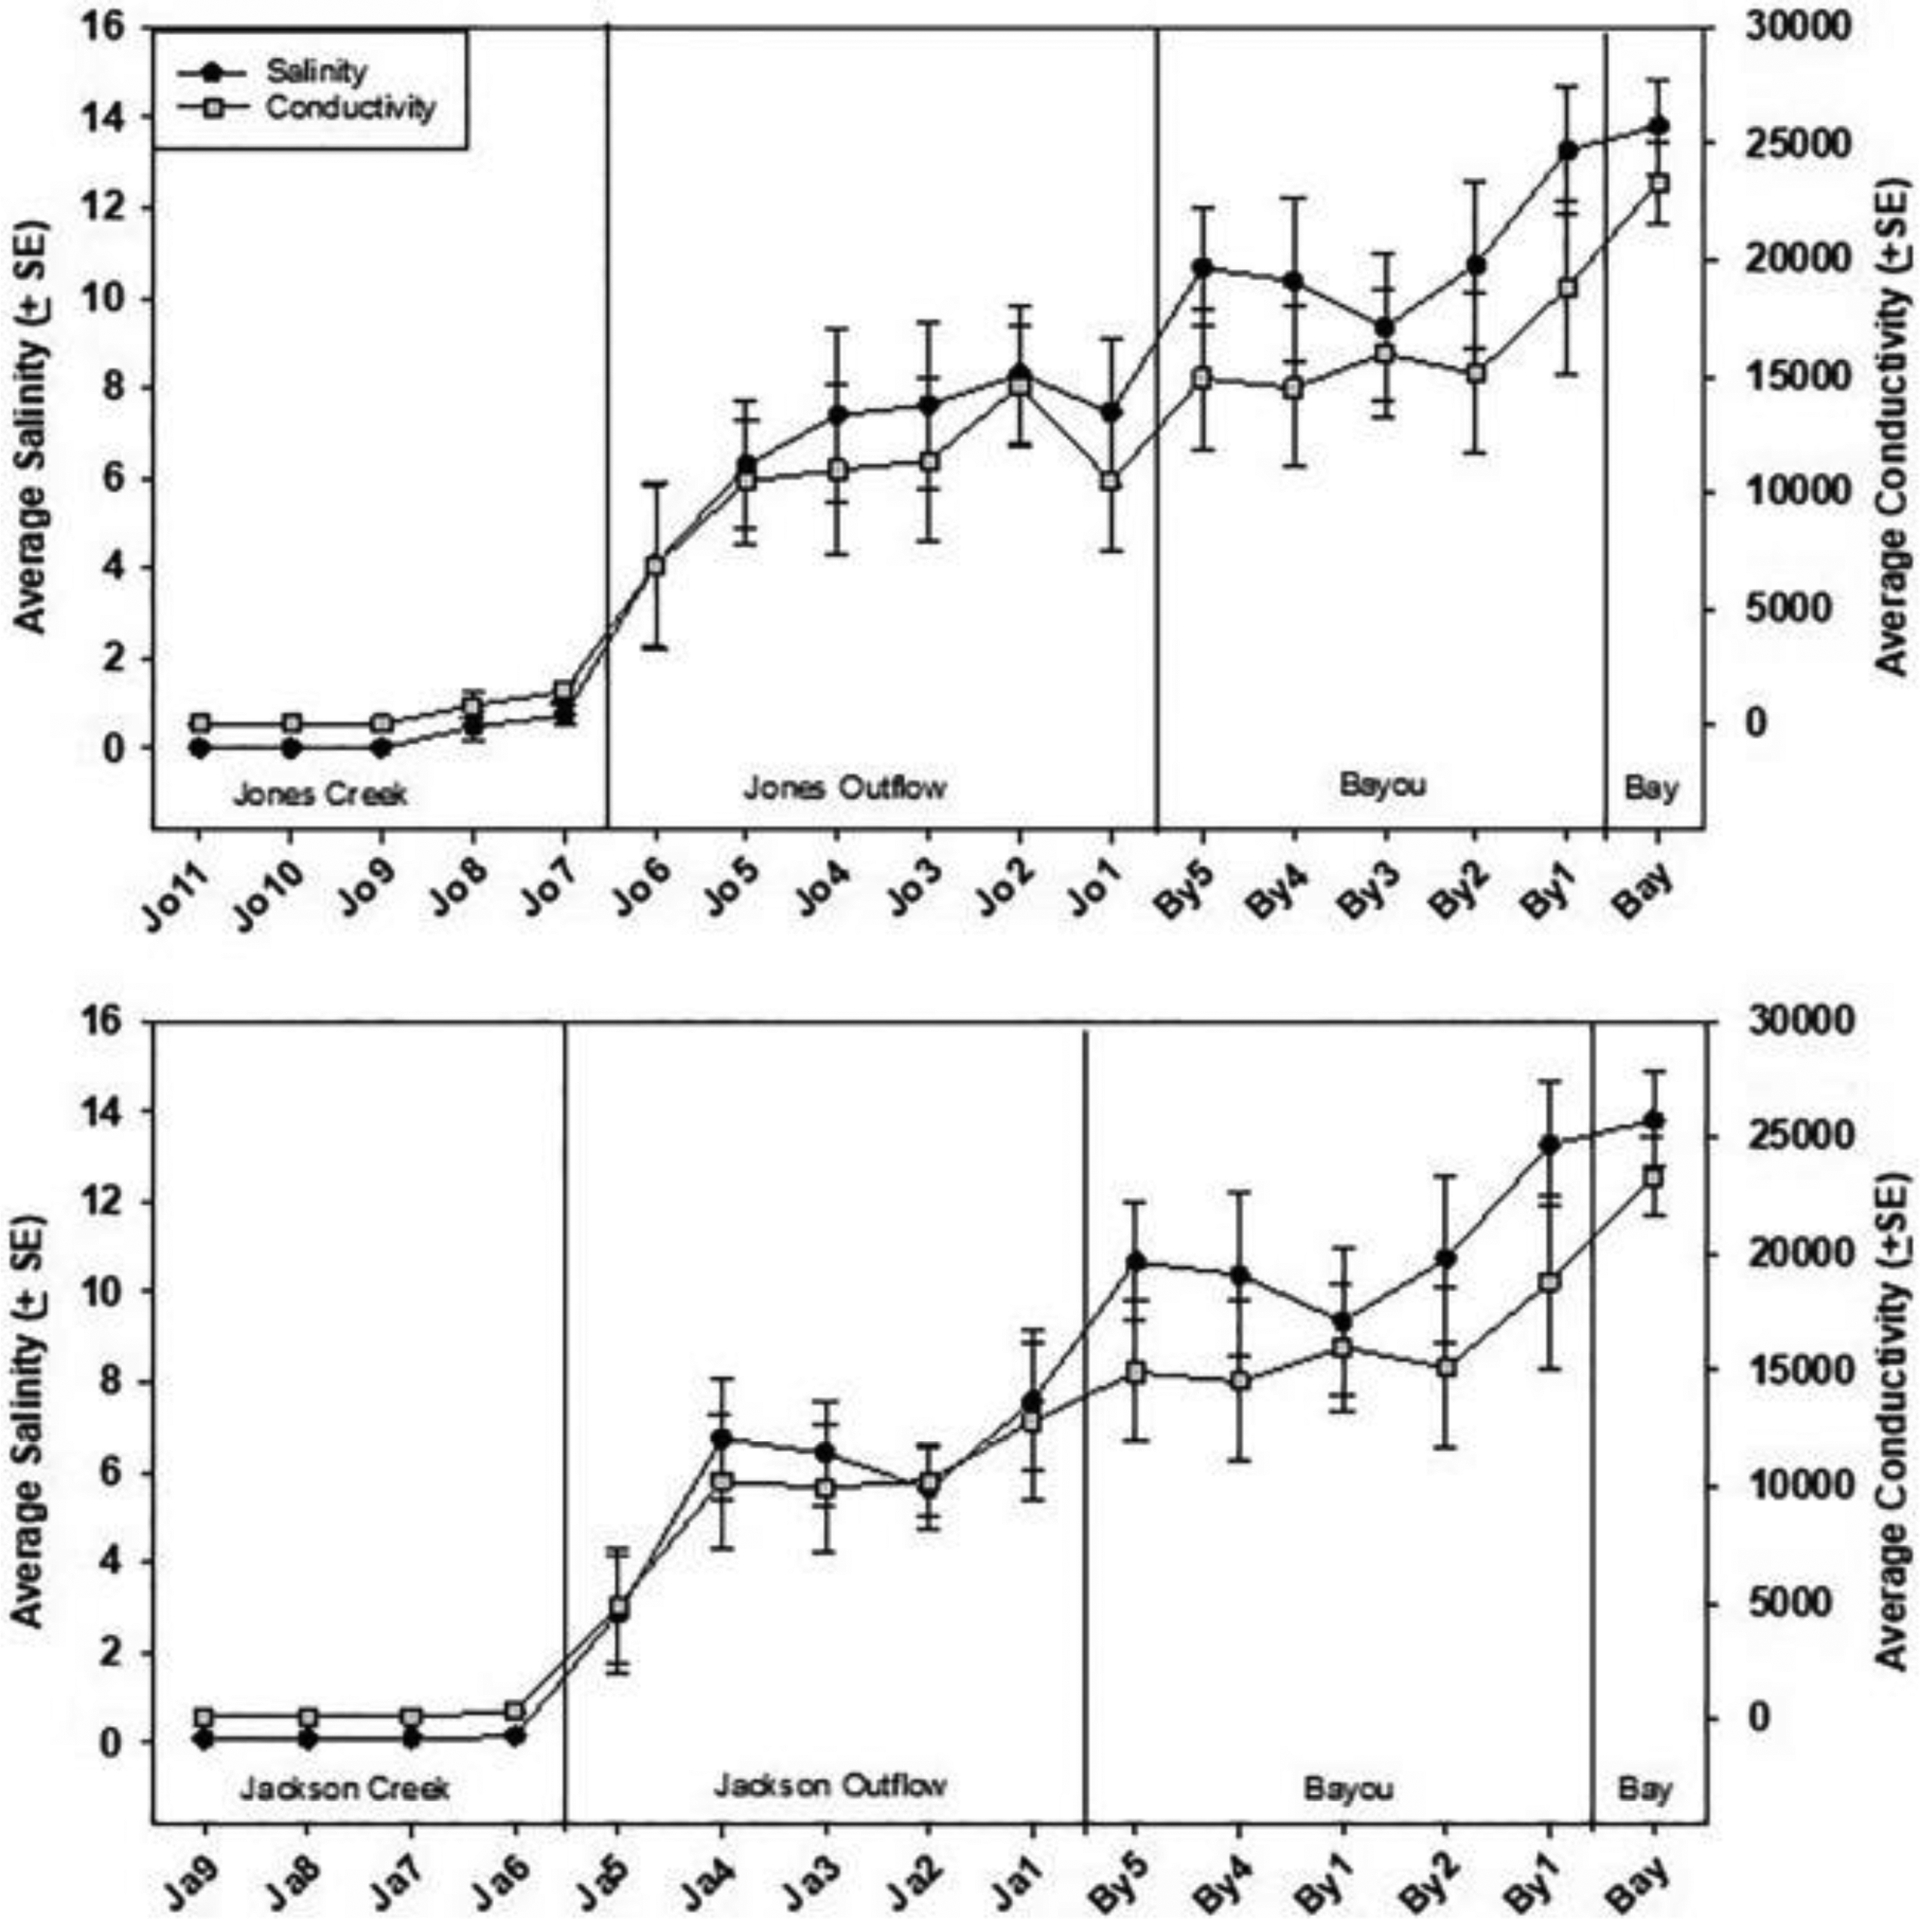
Fig. 2.

Salinity and conductivity of Jackson and Jones creeks and Bayou Chico. Sampling sites are arrayed independent of distance measurements on the horizontal axis from the most upstream locations on the left to the mouth of the bayou and an adjacent Pensacola Bay site on the right. Note the same data for the bayou sites are used in both graphs for demonstration. Error bars are standard error of all data collected at a specific site (N = 8 to 25).
