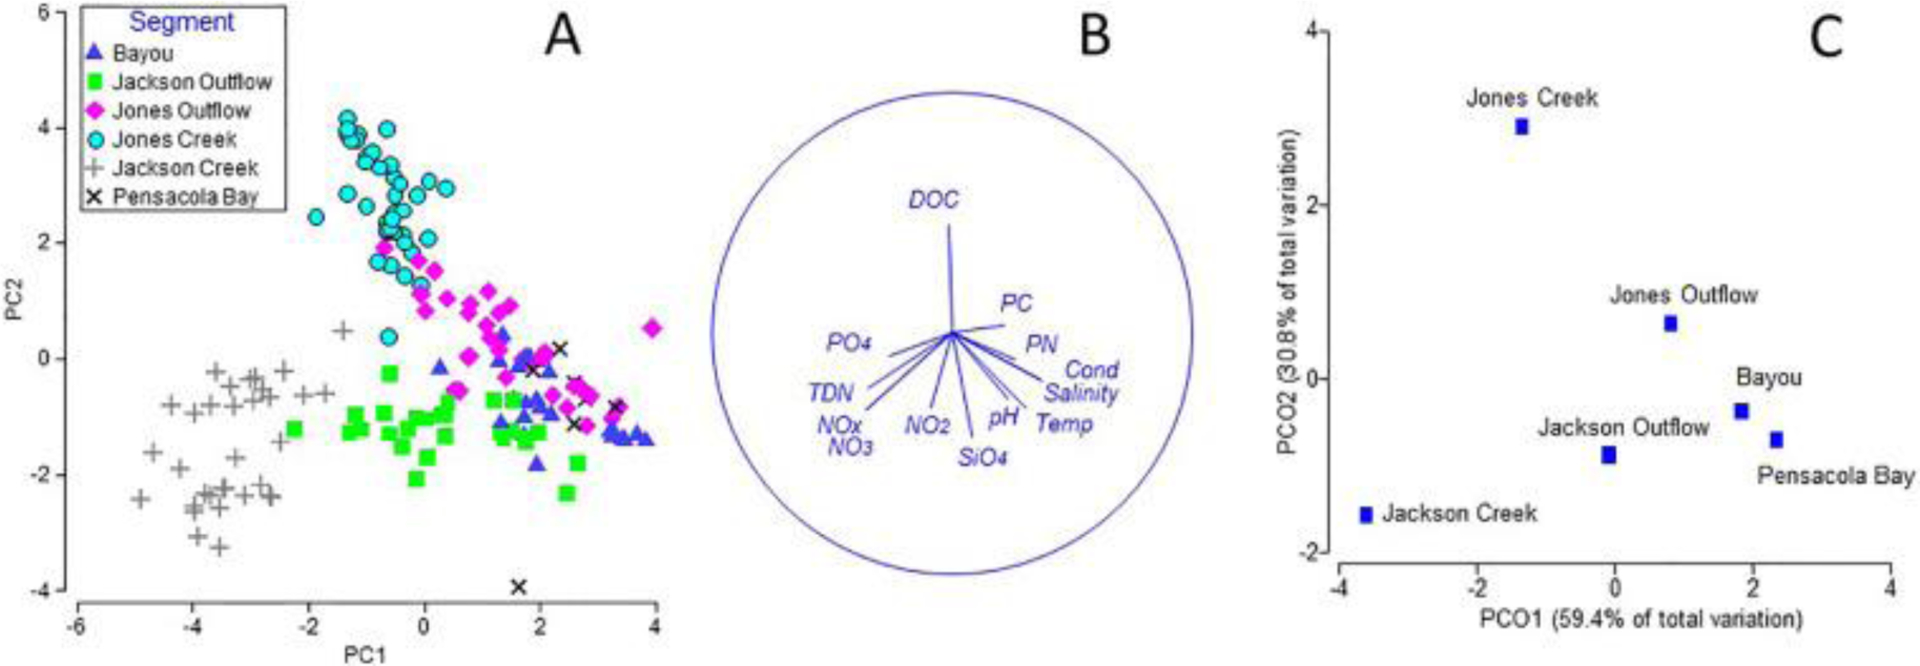
Fig. 3.

Interactions among water quality variables and clustering of segments and seasons. Data are grouped by segments of Jackson Creek, Jackson Outflow, Jones Creek, Jones Outflow, Bayou, and Pensacola Bay. A; Principal Components Analysis. B; Vector plot of parameters chosen to display a range of observed responses to the gradient, with the vector direction for each species reflecting the (Pearson) correlations of their (square root-transformed) counts with the two ordination axes and length giving the multiple correlation coefficient on the ordination points (the circle is a correlation of 1). C; Principal Coordinate Analysis of centroids of seqments in the PCA.
