. 2022 Feb 15;304(3):553–562. doi: 10.1148/radiol.212559

Figure 3:

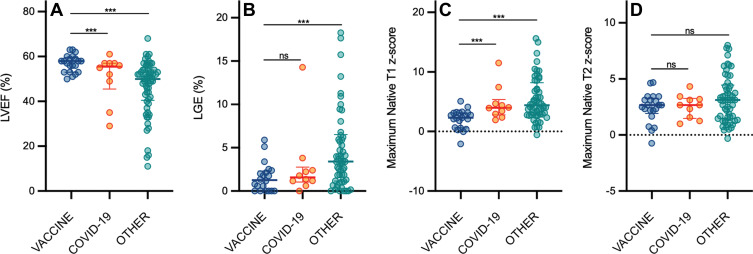
Scatterplots show (A) left ventricular ejection fraction (LVEF), (B) late gadolinium enhancement (LGE), (C) native T1, and (D) native T2 according to patient group. Graphs for MRI parameters depict individual patient data points with error bars displayed as medians and IQRs. There were significant differences in the maximum native T1 z score, maximum native T2 z score, and LGE extent (as a percentage of left ventricular mass) between patients with vaccine-associated myocarditis (vaccine) and those with other myocarditis (other). All other comparisons between patients with vaccine-associated myocarditis and patients with COVID-19 illness (COVID-19) or other myocarditis were not significant (ns). *** = P < .05; statistically significant.

Scatterplots show (A) left ventricular ejection fraction (LVEF), (B) late gadolinium enhancement (LGE), (C) native T1, and (D) native T2 according to patient group. Graphs for MRI parameters depict individual patient data points with error bars displayed as medians and IQRs. There were significant differences in the maximum native T1 z score, maximum native T2 z score, and LGE extent (as a percentage of left ventricular mass) between patients with vaccine-associated myocarditis (vaccine) and those with other myocarditis (other). All other comparisons between patients with vaccine-associated myocarditis and patients with COVID-19 illness (COVID-19) or other myocarditis were not significant (ns). *** = P < .05; statistically significant.