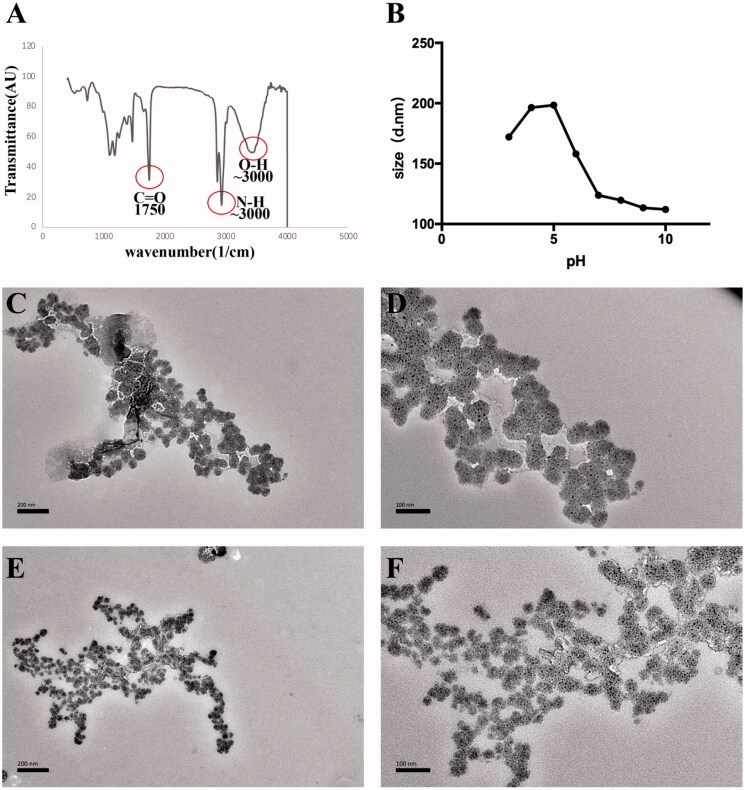
Figure 2.
Characterization of poly(DMAEMA-co-HEMA). (A) FT-IR spectrum of poly(DMAEMA-co-HEMA). (B) Size of poly(DMAEMA-co-HEMA) at different pH values of 3, 4, 5, 6, 7, 8, 9, and 10. (C) TEM imaging of poly(DMAEMA-co-HEMA) at pH = 4.5 (×20,000 magnification). (D) TEM imaging of poly(DMAEMA-co-HEMA) at pH = 4.5 (×40,000 magnification). (E) TEM imaging of poly(DMAEMA-co-HEMA) at pH = 7 (×20,000 magnification). (F) TEM imaging of poly(DMAEMA-co-HEMA) at pH = 7 (×40,000 magnification).

