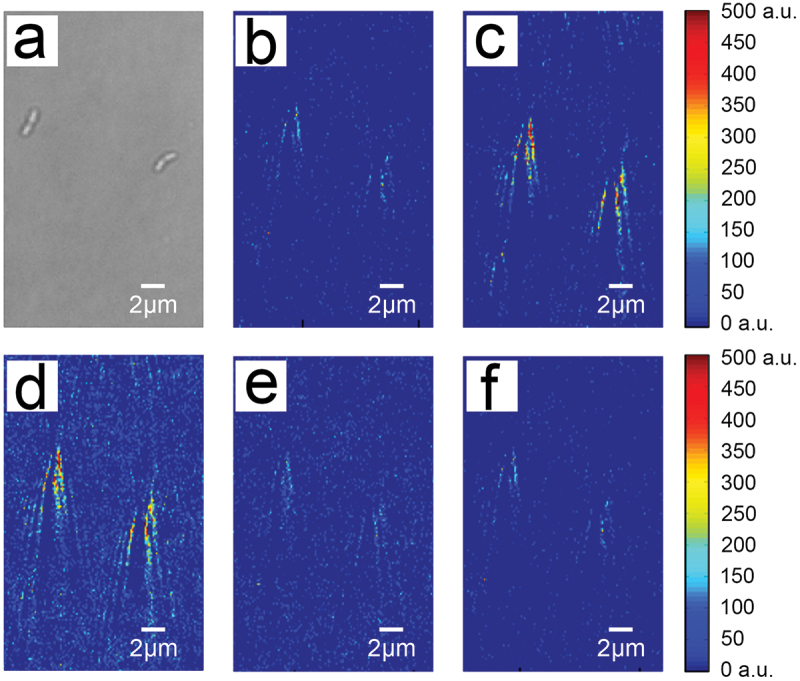
Figure 2.

Time-differential plasmonic images of the binding process of two S. mutans cells to 1.0 mg/L sucrose. (a) A representative bright-field image. (b) The background image of S. mutans with the flow of PBS corresponding to the same cells as in (a). Time-differential plasmonic images captured during the association process at an earlier (c) and later (d) time point. Time-differential plasmonic images captured during the dissociation process at an earlier (e) and later (f) time point.
