Figure 3.

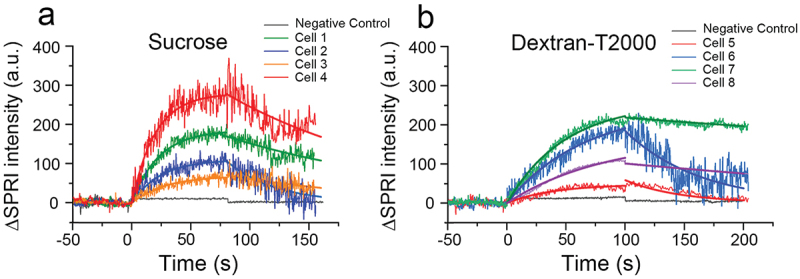
Sensorgrams of single bacterial cells exposed to 0.1 mg/mL sucrose (a) and 0.02 mg/L dextran (b) solutions, and the fitting curves of the bacterial SPRI signals according to formulas (5) and (9) in .Section 2.3.1

Sensorgrams of single bacterial cells exposed to 0.1 mg/mL sucrose (a) and 0.02 mg/L dextran (b) solutions, and the fitting curves of the bacterial SPRI signals according to formulas (5) and (9) in .Section 2.3.1