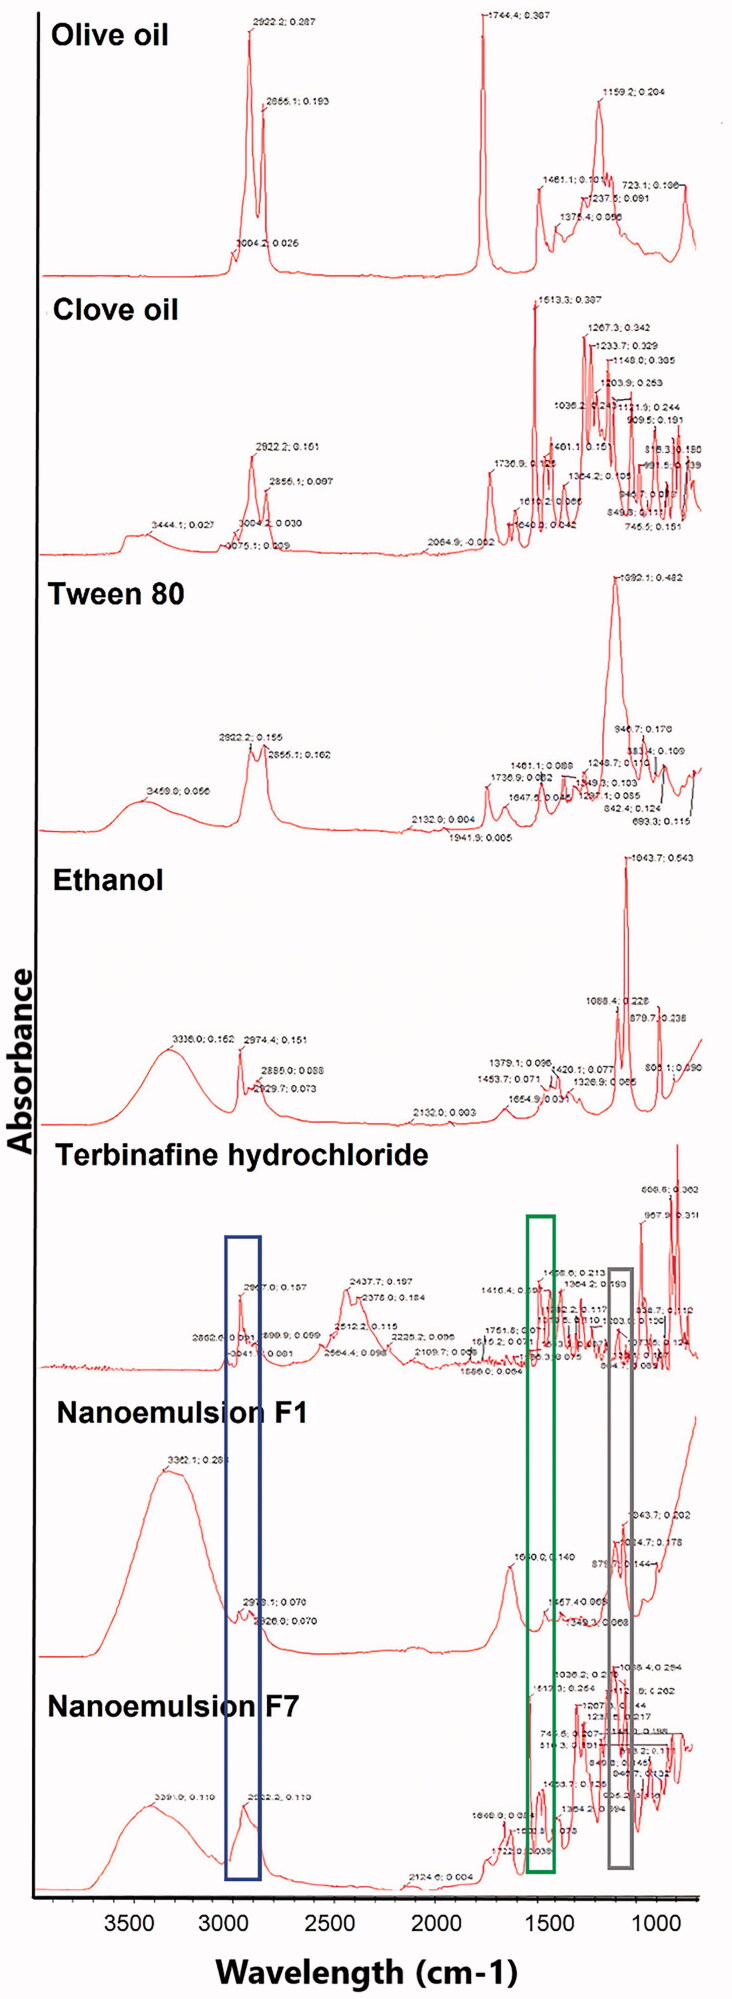
Figure 3.
FTIR spectra from top to down: TF-HCl, olive oil, clove oil, Tween 80, ethanol, nanoemulsion F1, and nanoemulsion F7. Wavelength areas representing functional groups of TF-HCl are framed in the figure: C = C stretching (green), C–N bending (black), and aromatic alkenyl C = C–H (blue) stretching bands (Anju and Kuriachan, 2017). These peaks were found either unchanged or very slightly shifted in nanoemulsion spectra.

