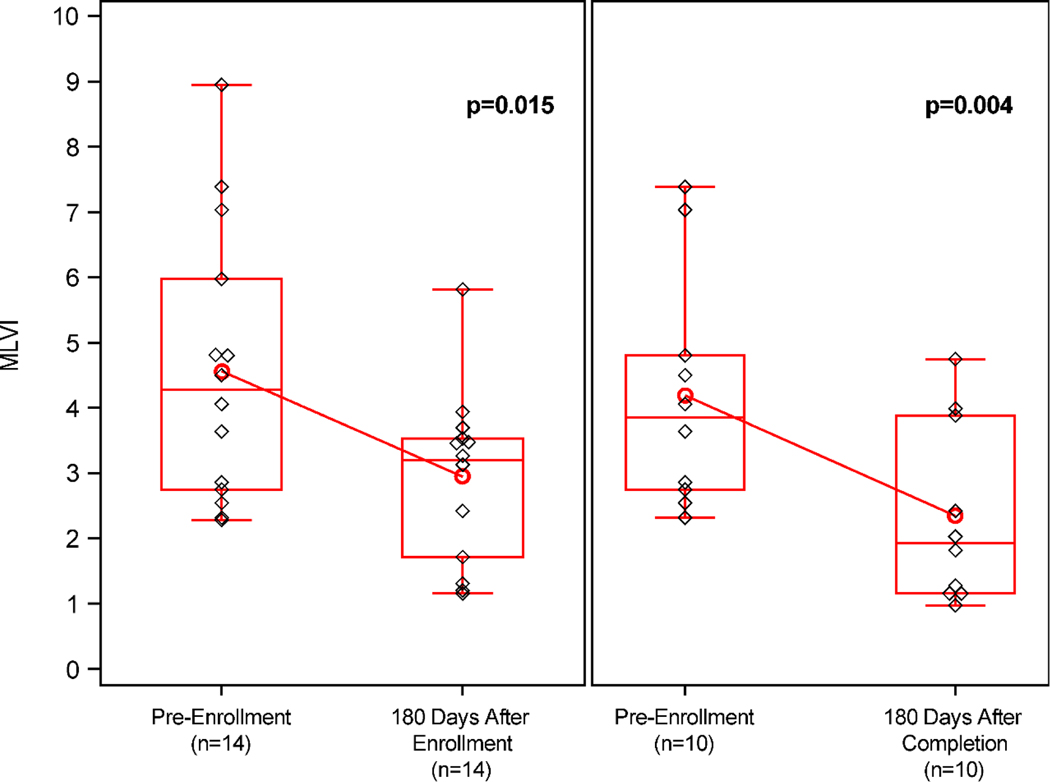
Figure 2. Change in MLVI pre-enrollment, 180 days post-enrollment, and 180 days after final session.
Paired analysis of change in MLVI from pre-enrollment to 1) 180 days post-enrollment (n=14, p=0.015) and 2) 180 days after final session (n=10, p=0.004). Boxes represent interquartile ranges. Whiskers extend to minimum/maximum values. Red horizontal lines represent group medians; red circles represent group means. Black diamonds indicate individual subject MLVIs.

