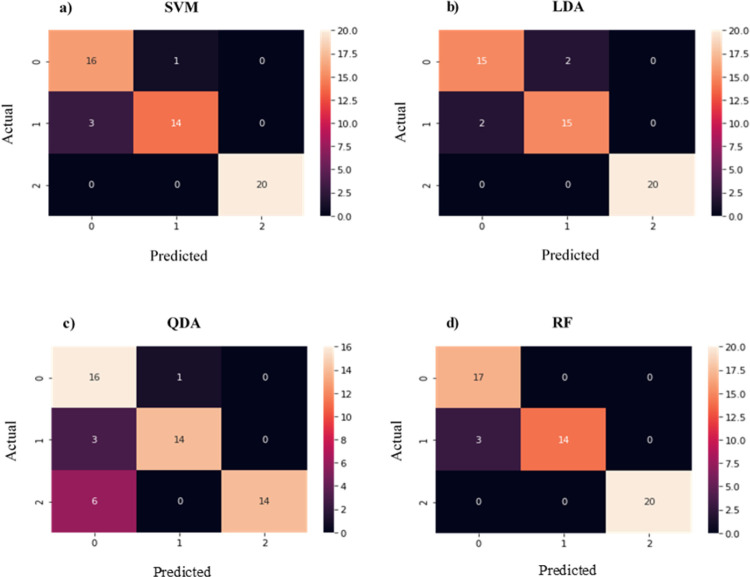
Fig 2. Confusion matrix results generated with one hot encoding, BoW and PCA on the dataset.
Numbers 0, 1 and 2 on the X and Y axis represent the African, Asian and Caucasian race groups, respectively. The values in the matrix denote the number of correct and incorrect predictions made by classifiers: (a) Support vector machine, (b) Linear discriminant analysis, (c) Quadratic discriminant analysis and (d) Random forest.

