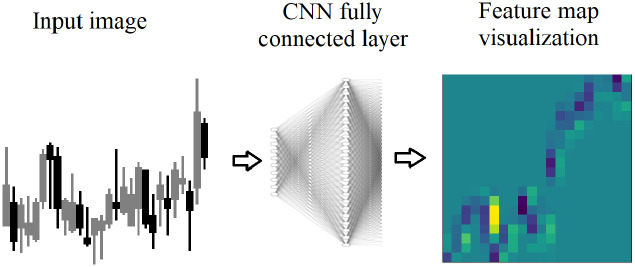
Fig 3. Feature map visualizations are generated from fully connected layers in the DDQN.
A candlestick image is input, and each neuron in the fully connected layer receives the image. The neuron is excited on various parts of the image. The excited regions are stored as a 2D array, and shown here as a heatmap.

