
Fig 7. Each DDQN is able to fit a function on the training data.
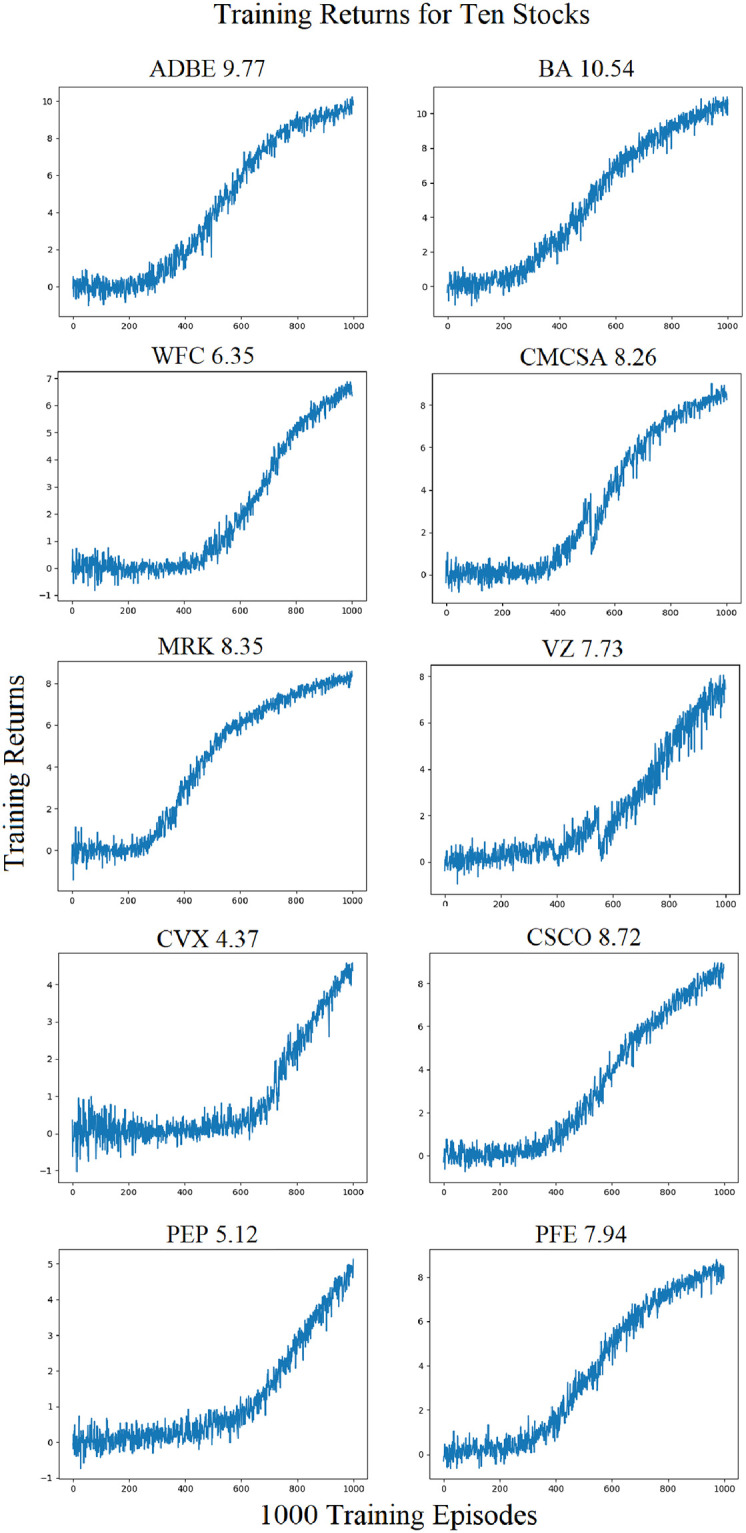
The training data consists of candlestick images representing stock market prices from Jan 01, 2013 through Dec 31, 2019. Final episode training rewards are shown above each training curve.