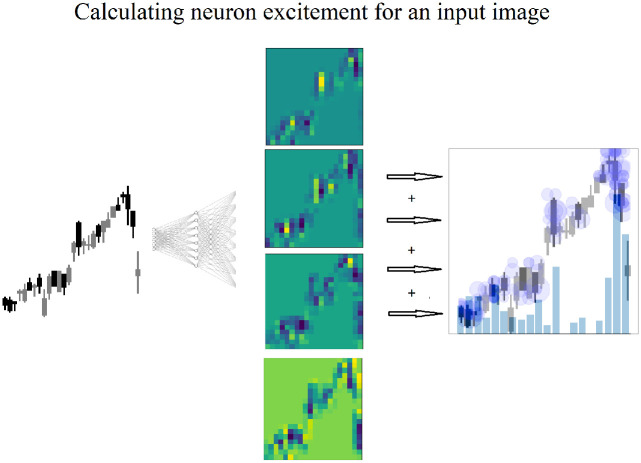
Fig 9. The highest level of neuron excitement, shown in yellow, for each the feature map generated from each neuron, is summed revealing the highest levels of neuron excitement by day for a single candlestick image.
The size of the blue dot corresponds to the neuron excitement value. The darkness of the blue dots is caused by multiple dots overlapping. This indicates multiple neurons have produced neuron excitement on the same region. Dark blue dot clusters indicate high levels of neuron excitement. The level of neuron excitement can be seen by the overlaid blue bar chart.

