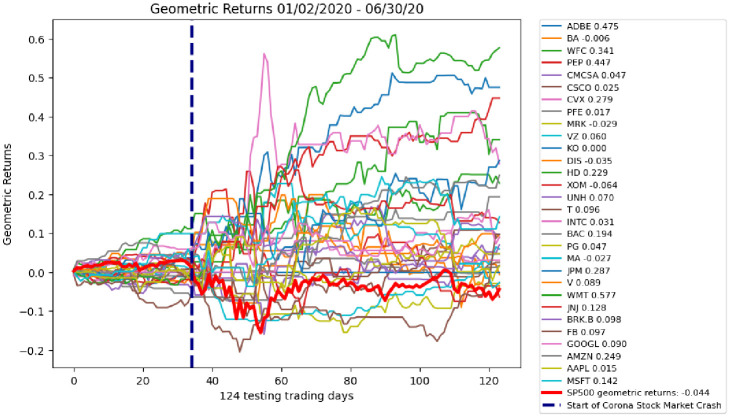
Fig 10. Testing geometric returns for 30 stocks.
The average geometric returns is 13.2%. All but one (Exxon Mobile -6%) yield higher geometric daily returns than the S&P 500 Index. S&P 500 Index geometric daily returns are shown in the bold red line. S&P 500 Index geometric daily returns for the testing data set are -4%.

