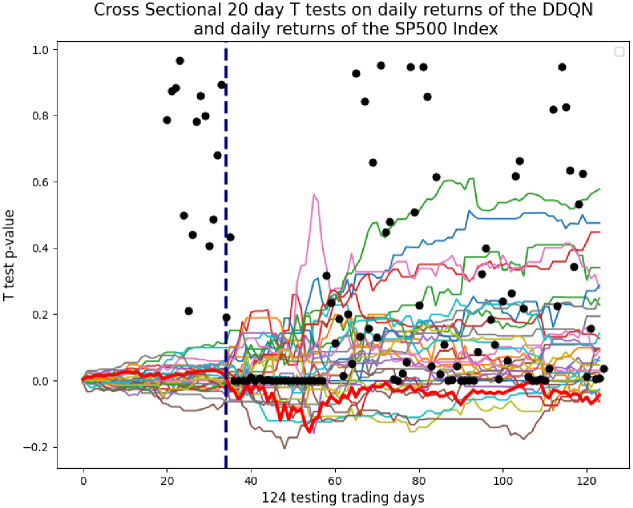
Fig 11. Cross Sectional 20 day T tests on daily returns of the DDQN, minus daily returns of S&P 500 Index.
Each black dot is the 20 day T test p-value. The line of 22 black dots indicates that during the 22 day period following the corona stock market crash, the daily returns of the DDQN are statistically significant and different than the daily returns of the S&P 500 Index.

