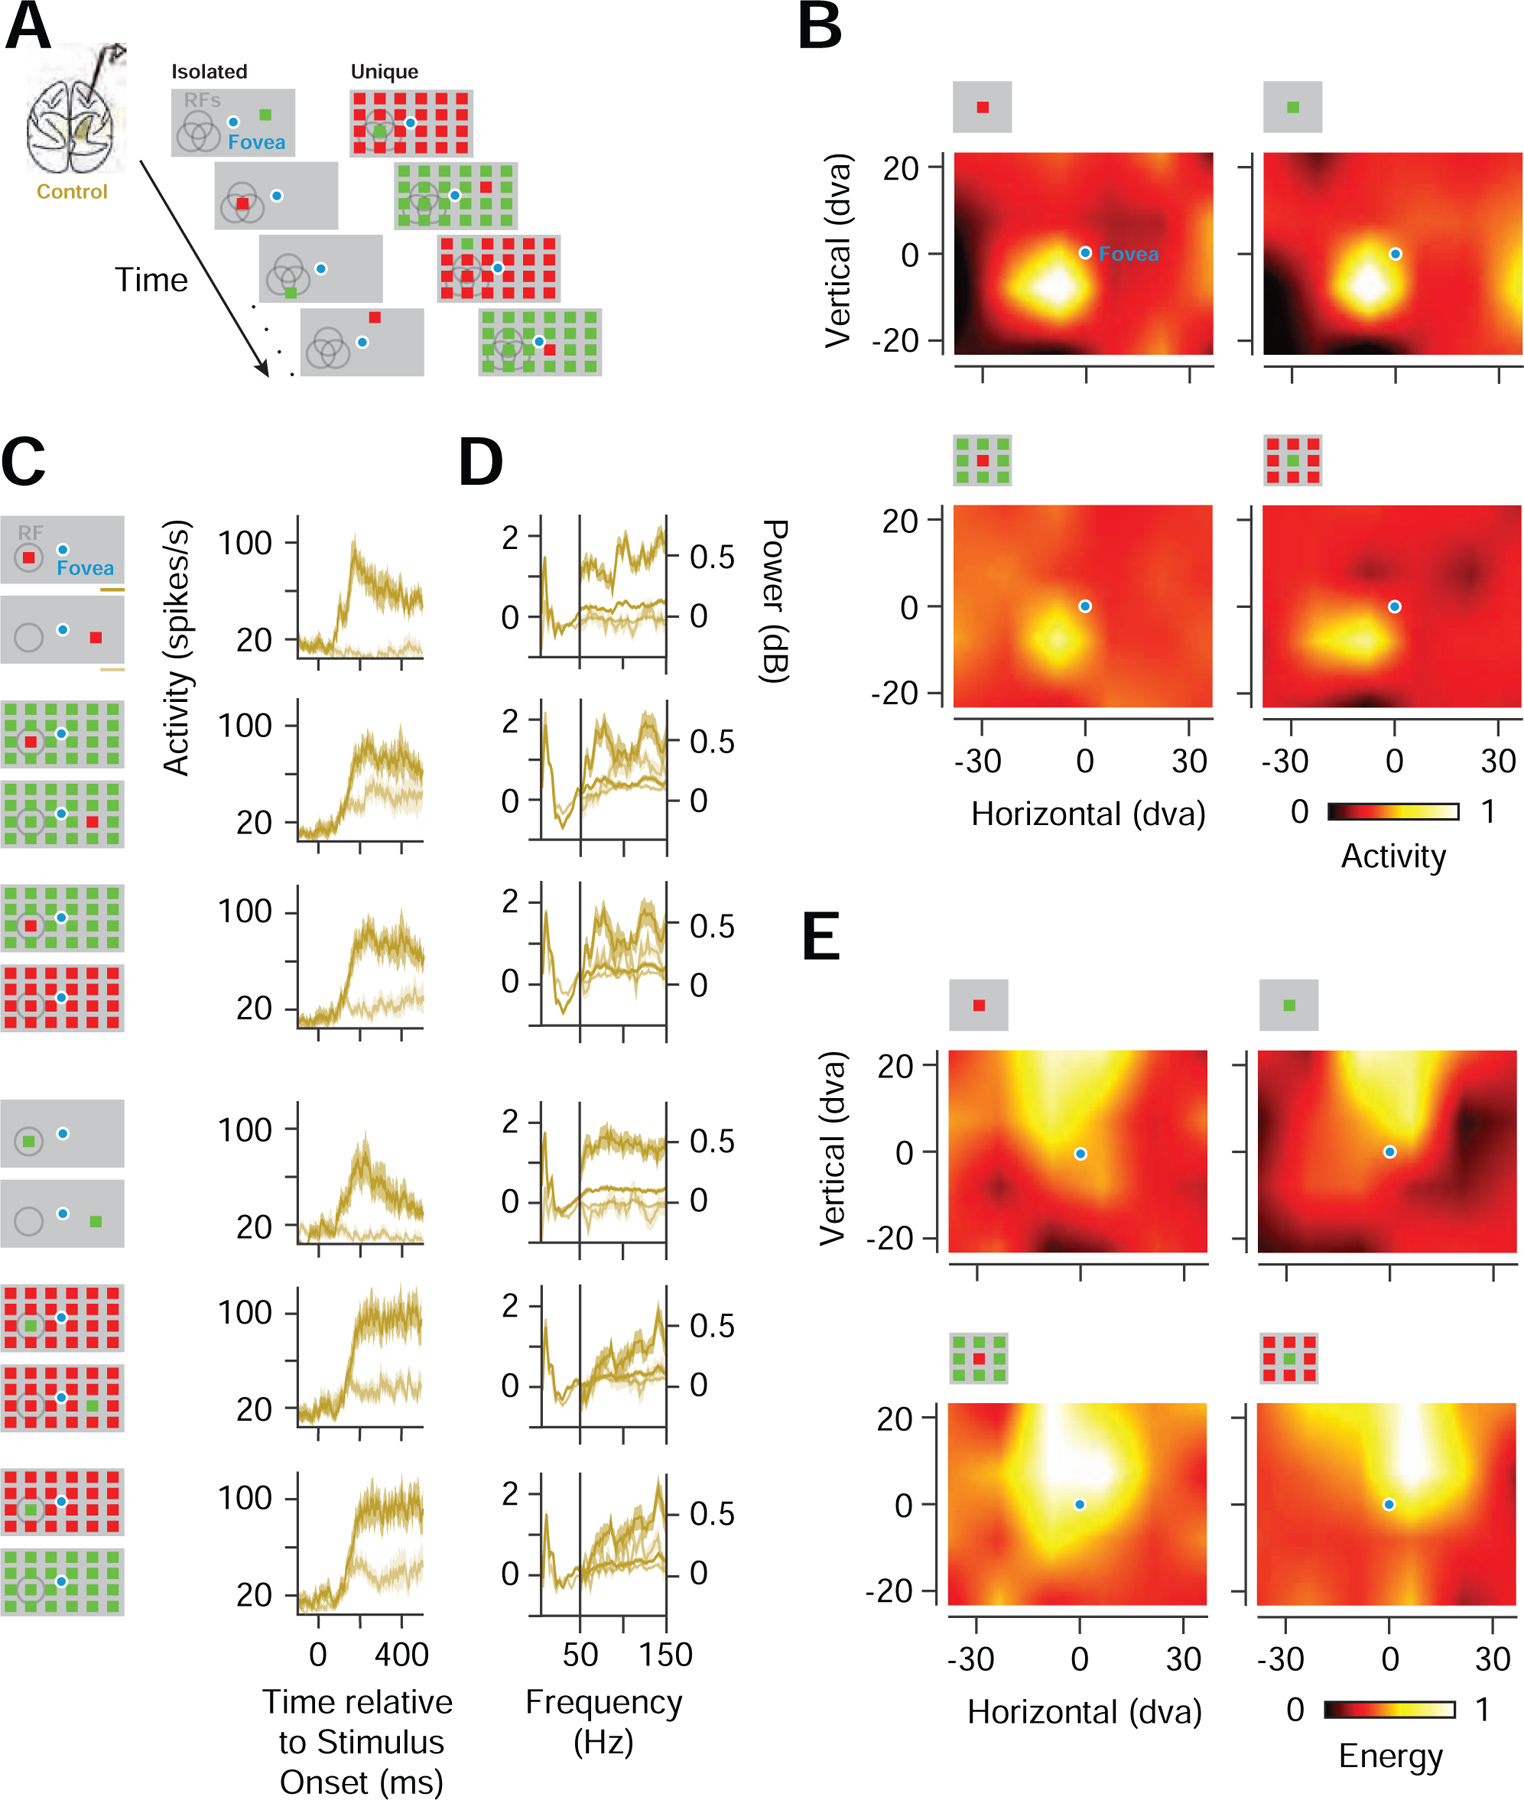
Figure 2. Prefrontal representation of visual salience in neuronal and LFP activity.

(A) Visual stimuli consisted of a single colored stimulus presented in isolation (Isolated), or among an array (6 ✕ 4) of identically colored stimuli (Unique). (B) Example CRFs of a single FEF neuronal recording mapped with an isolated red or green stimulus (top) and URFs of the same neuronal recording mapped with a unique red or green stimulus (bottom). Responses were normalized across stimulus conditions. Icons above each RF denote stimulus conditions, but not the full array. (C) Spiking responses from an example neuronal recording to isolated and unique stimuli presented inside the CRF/URF (dark gold), shown with responses to single and unique stimuli presented outside of the CRF/URF or to identically colored stimulus arrays (light gold) for two color polarities (left icons). (D) Response spectra of an example FEF LFP recording. Same conventions as in C. (E) High-gamma band CRFs and URFs for an example recording. Responses were normalized across stimulus conditions.
