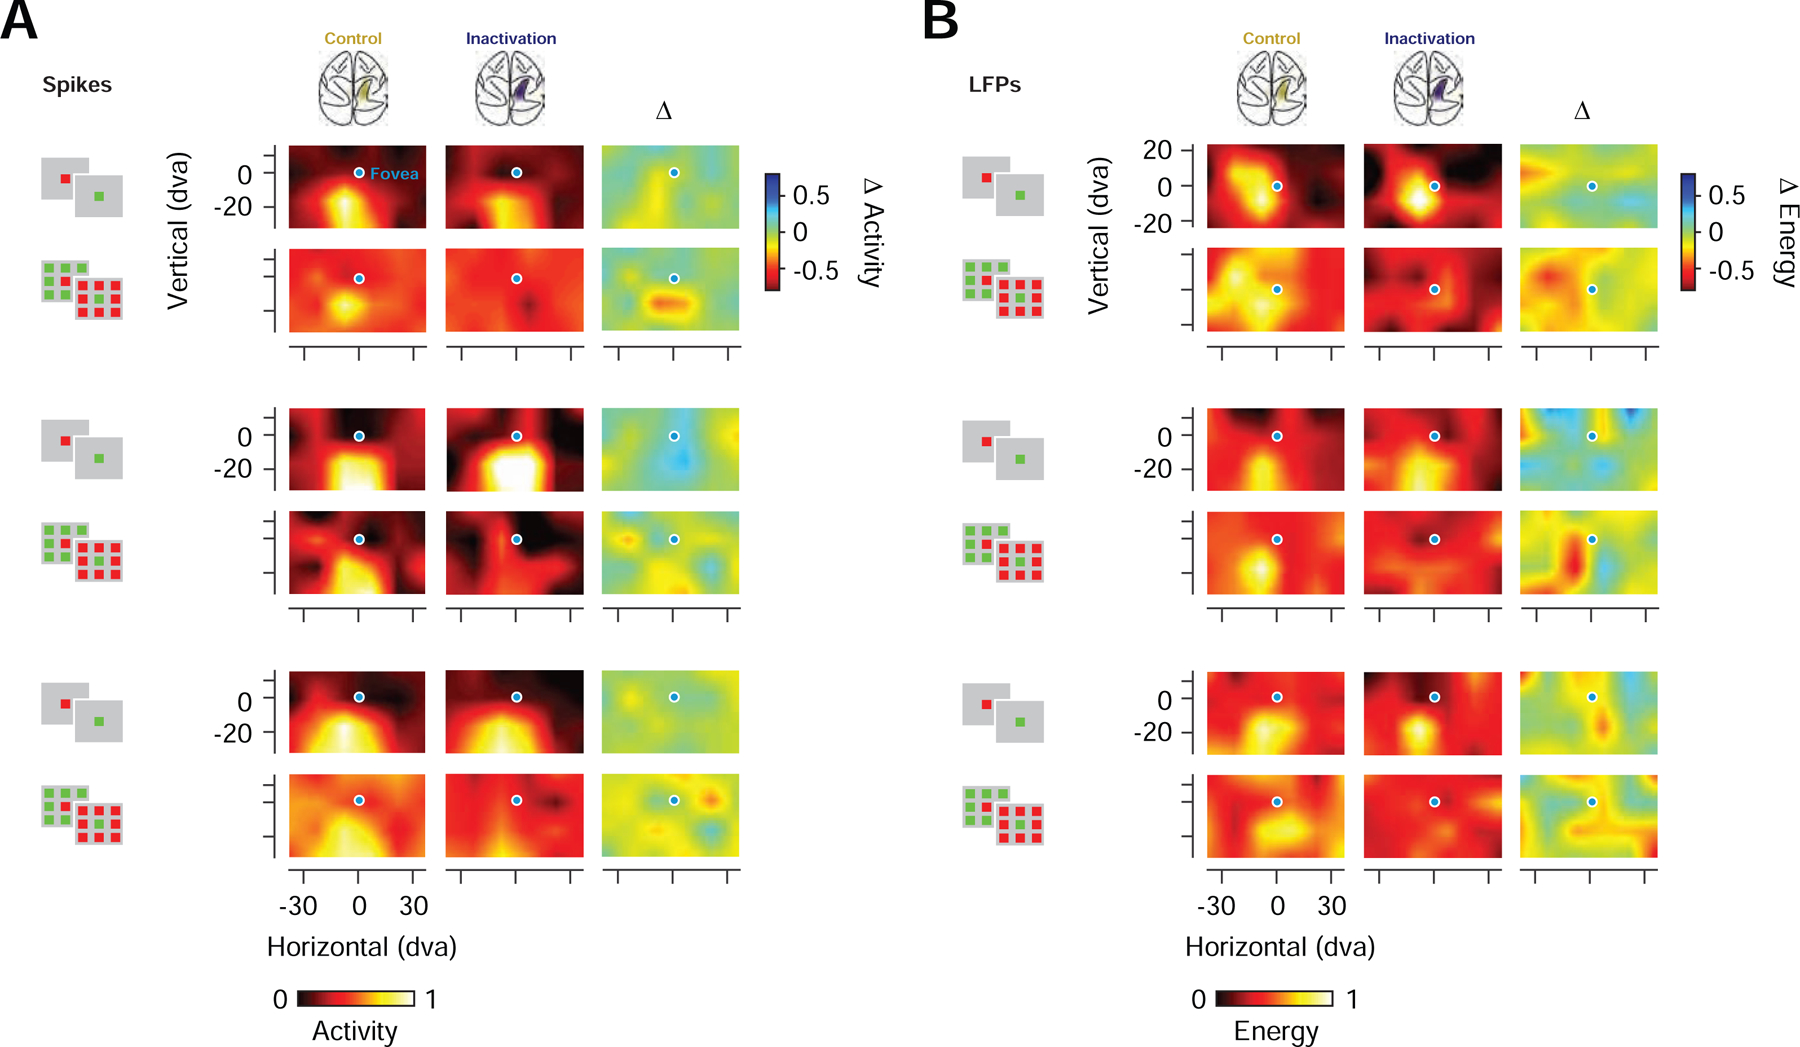
Figure 3. Prefrontal CRFs and URFs during PPC inactivation.

(A) CRFs and URFs for three example neuronal recordings during control (left) and PPC inactivation (middle), shown together with their respective difference maps (inactivation - control) (right). Activity for each recording was normalized across all stimulus and experimental conditions (B) CRFs and URFs for three example LFP recordings (high-gamma band). Same organization and notation as in A.
