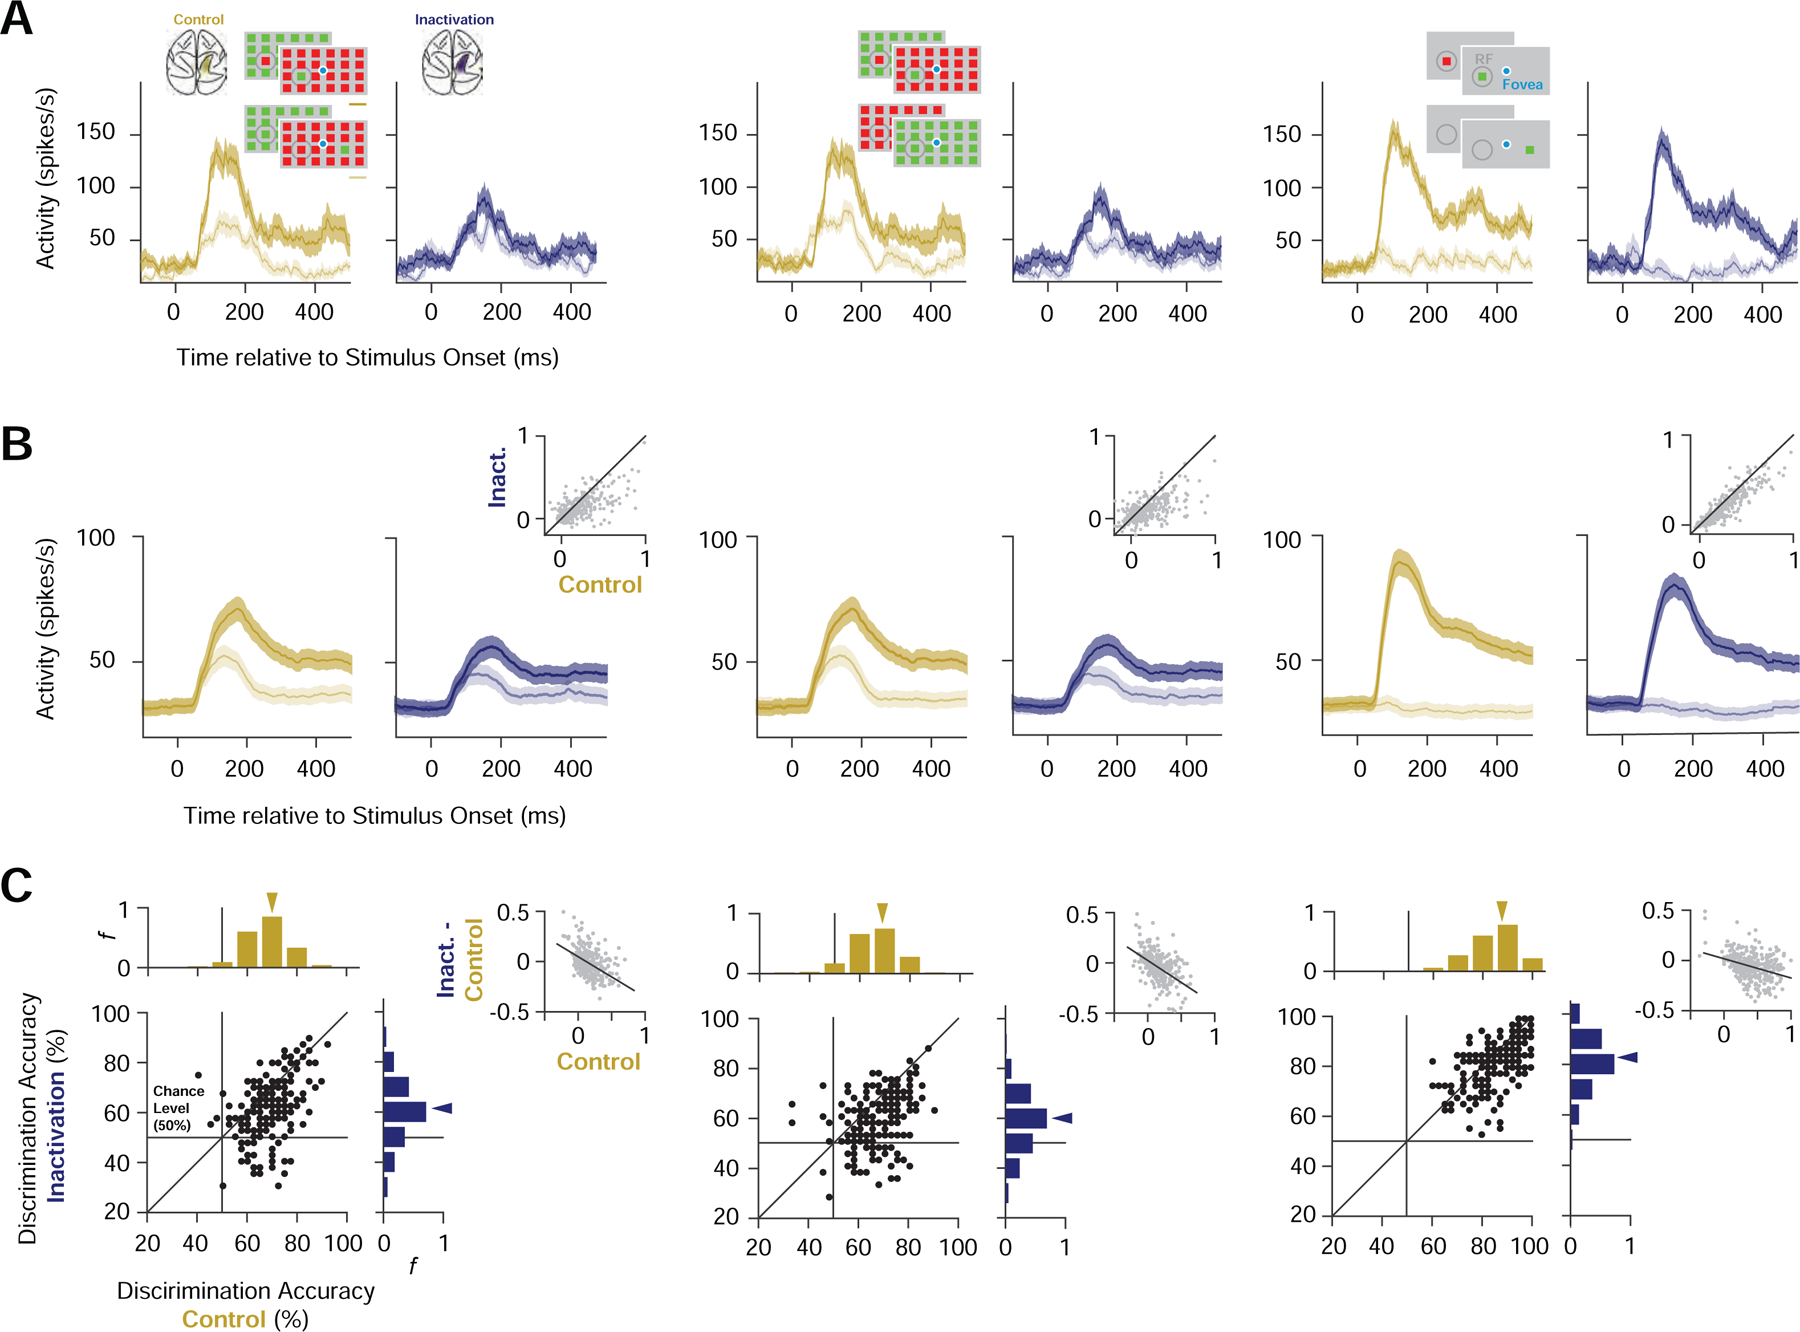
Figure 4. Representation of salience in prefrontal neuronal activity during PPC inactivation.

(A) Mean responses of an example neuron to different stimulus conditions during control (gold) and PPC inactivation (blue). Left, responses to UniqueIn (dark) and UniqueOut (light) stimuli. Middle, responses of the same neuron to UniqueIn (dark) and Identical (light). Right, responses of the same neuron to the isolated stimuli presented inside (dark) and outside of the CRF (light). Shading around the response denotes ±SEM. (B) Mean responses for all modulated neurons (n = 193) during control and inactivation blocks for each of the stimulus comparisons (UniqueIn vs. UniqueOut, UniqueIn vs. Identical, IsolatedIn vs. IsolatedOut). Same notation as in A. Gray scatterplots show the reduction in response differences for all recordings (n = 352). (C) Accuracy of classifiers trained on neuronal spiking activity to discriminate between different stimulus conditions during control and PPC inactivation. Left, accuracy of classifiers trained to discriminate between UniqueIn and UniqueOut stimuli. Middle, accuracy of classifiers trained to discriminate between UniqueIn and Identical stimuli. Right, accuracy of classifiers trained to discriminate between Isolated stimuli appearing inside and outside of the CRF. Scatter plots and marginal distributions compare discrimination accuracies across stimulus selective neuronal recordings (n = 193) during control and inactivation. Gray scatterplots show the reduction in enhancement indices during inactivation as a function of enhancement indices measured during control for all recordings (n = 352). Black lines show the linear regression fits.
