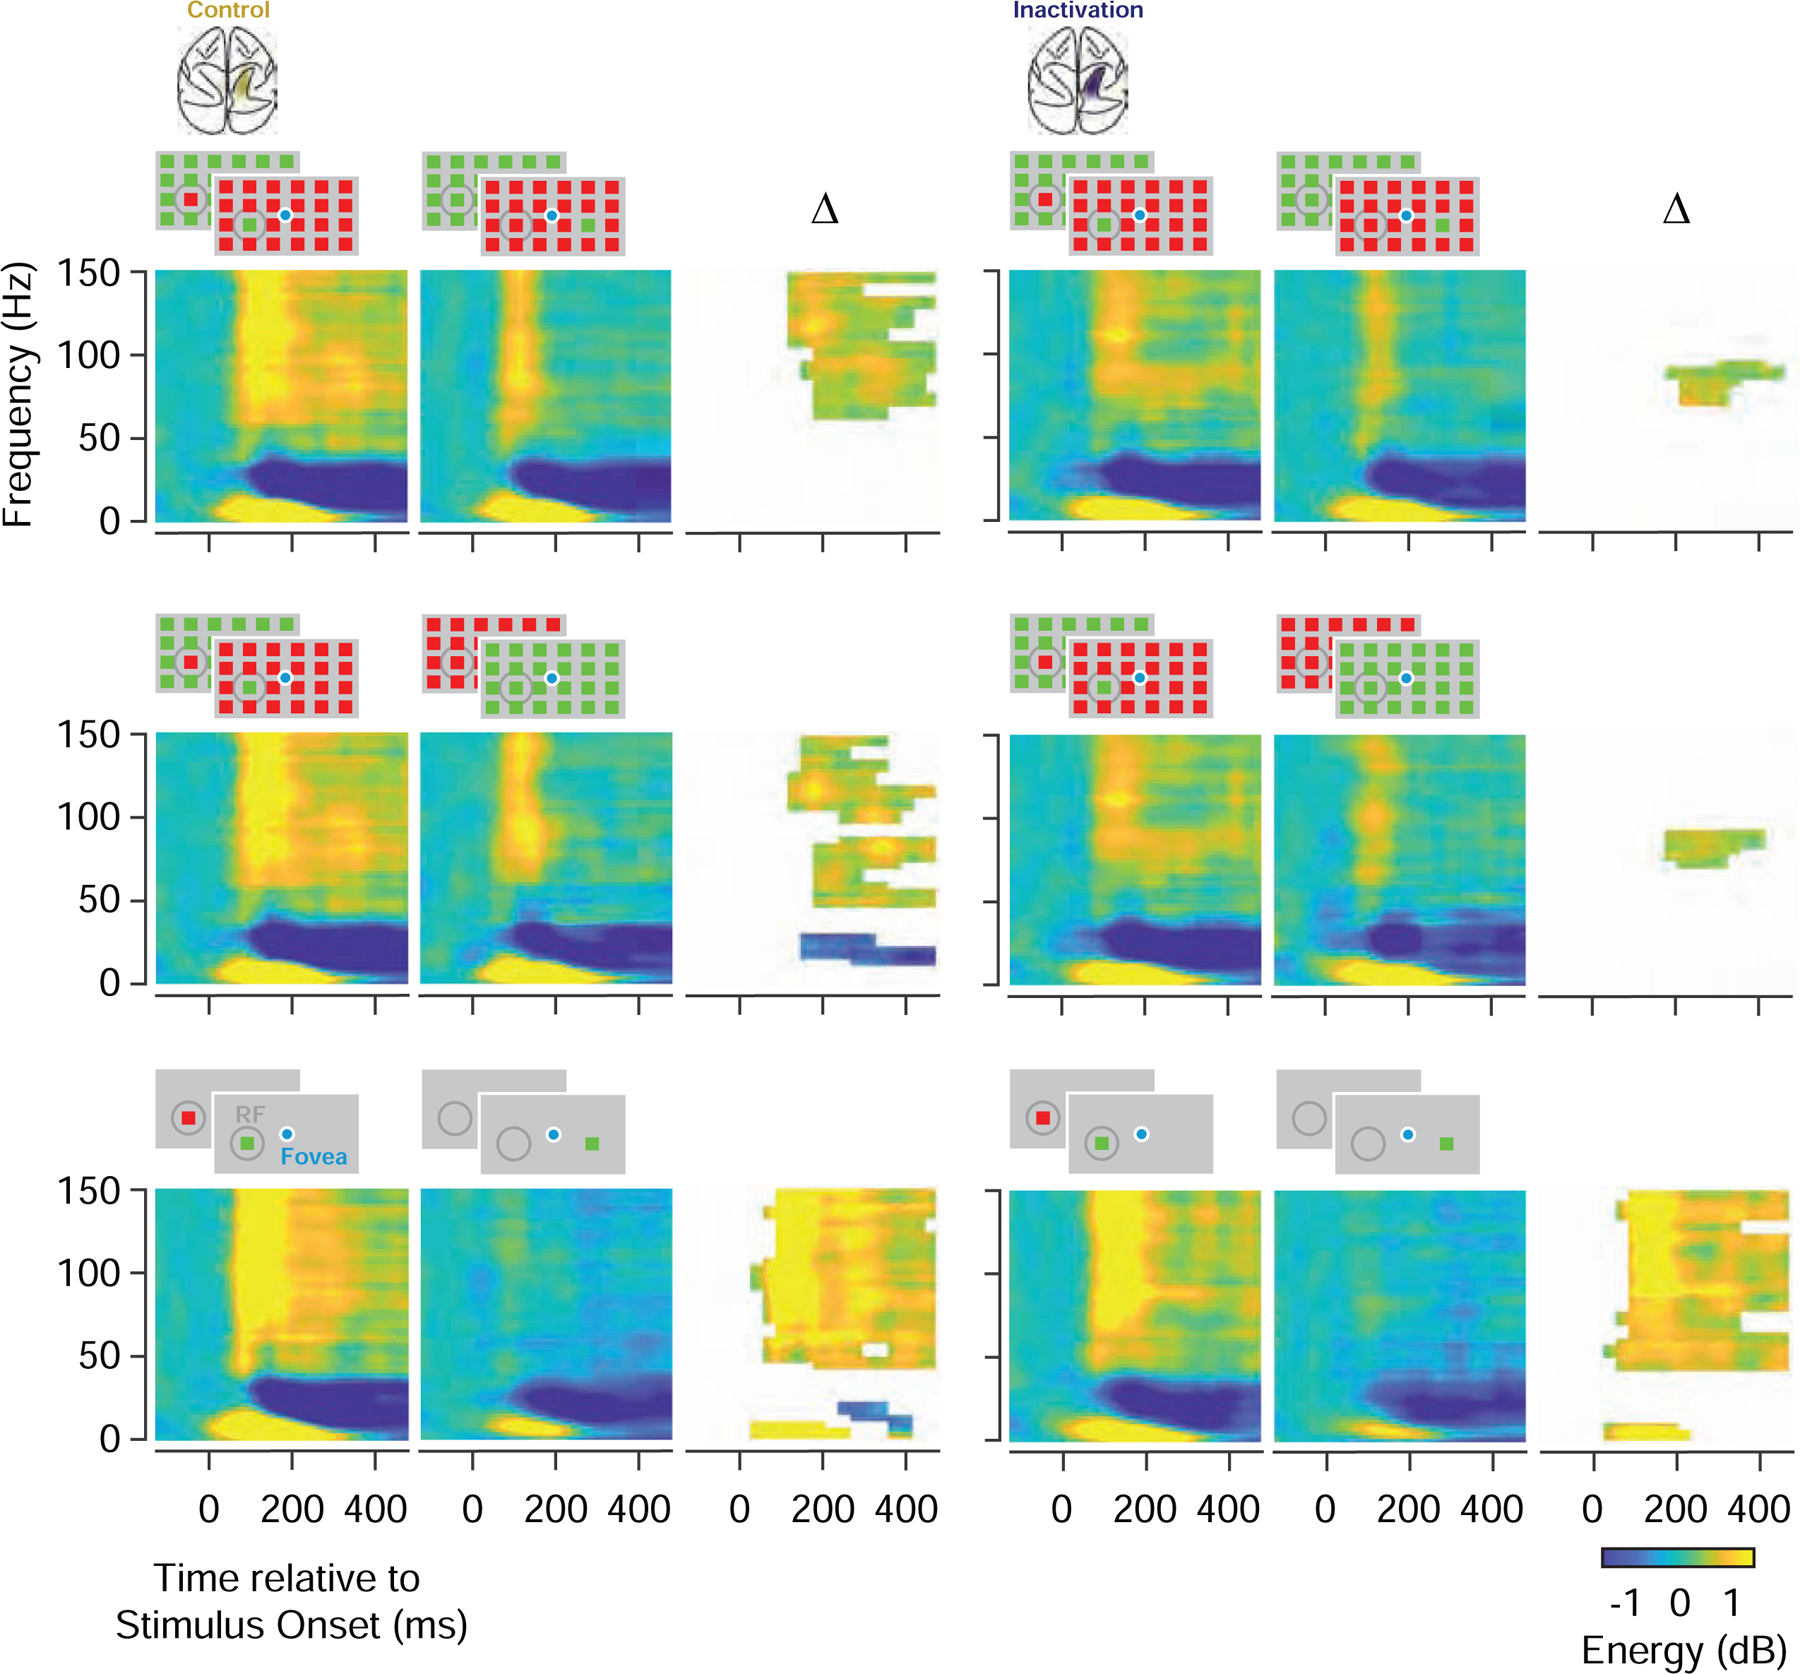
Figure 5. Representation of salience in prefrontal LFPs during PPC inactivation.

Comparison of average LFP time-frequency power spectrograms during control (left) and PPC inactivation (right) (N=192). The first row compares the spectrograms of responses to UniqueIn and UniqueOut stimuli, and their differences (∆) during control and inactivation. The second row compares responses to UniqueIn and Identical stimuli, and the third row compares responses to Identical stimuli presented inside or outside of the CRF. Difference plots only show time-frequency bins with significant energy differences.
