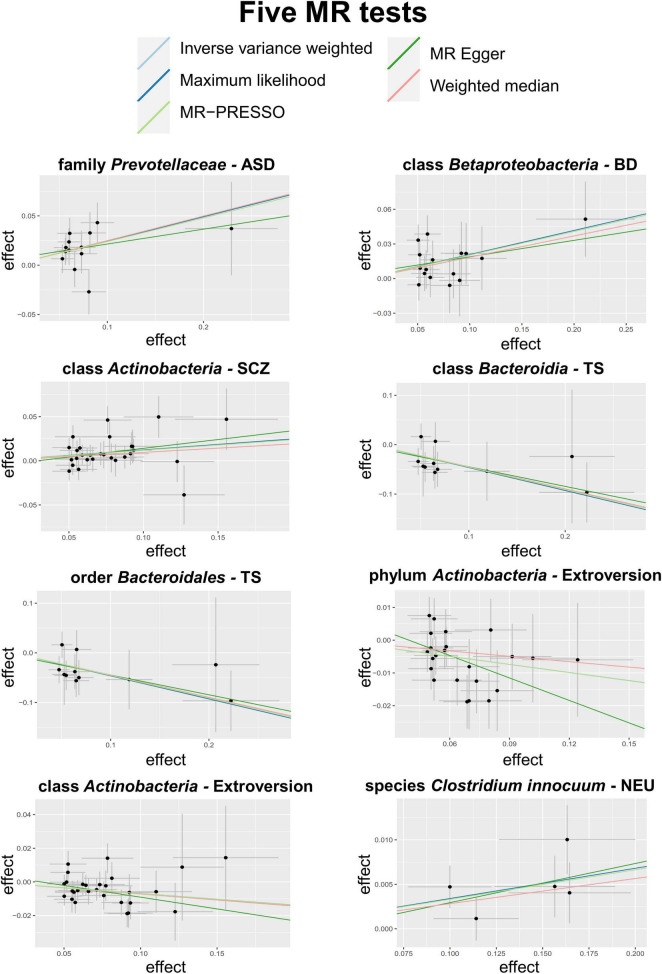
FIGURE 2.
Scatter plots of the 5 MR tests in 8 causal associations from 7 bacterial features to 6 psychiatric disorders/traits. SNP effects were plotted into lines for the inverse-variance weighted test (light blue line), MR-Egger regression (green line), weighted median estimator (red line), MR-PRESSO (light green line) and maximum likelihood estimator (blue line). The slope of the line corresponded to the causal estimation.

