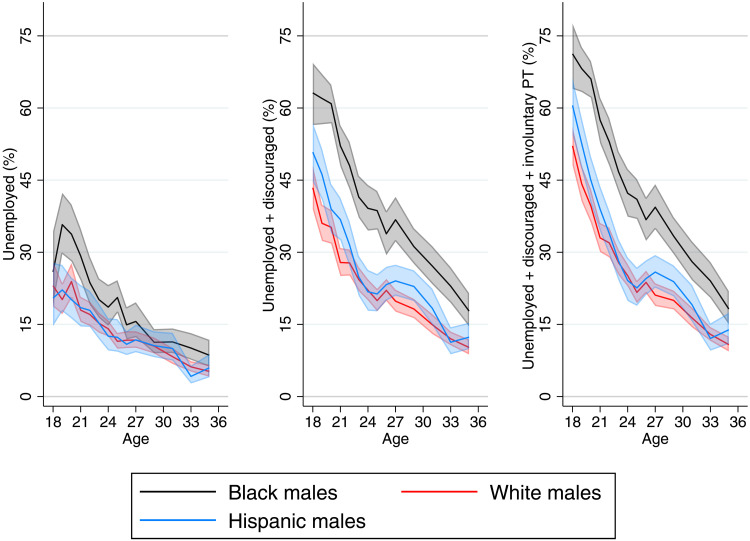
Fig. 1. Proportion of males in the labor force experiencing labor underutilization by age.
Leftmost panel displays proportion of unemployed, middle panel displays proportion of unemployed or discouraged, and rightmost panel displays proportion of unemployed, discouraged, or involuntarily part time (PT). Bands represent 95% confidence intervals.

