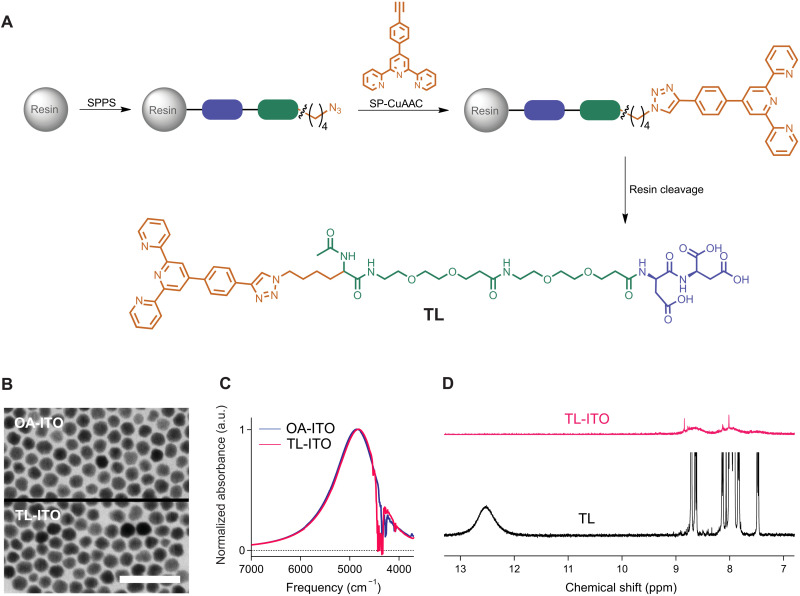
Fig. 1. Synthesis of TL and characterization of TL-ITO.
(A) Synthetic scheme of TL showing the terpyridine functional group (orange), PEG backbone (green), and tricarboxylic binding domain (blue). (B) STEM images of nanocrystals capped with native oleate ligands (top) and after TL functionalization (bottom). Scale bar, 50 nm. (C) LSPR absorption spectra of oleate-capped ITO nanocrystals (blue, in hexane) and TL-ITO dispersion (magenta, in DMF). a.u., arbitrary units. (D) 1H NMR spectra of TL (black) and TL-ITO (magenta) in deuterated dimethyl sulfoxide.

