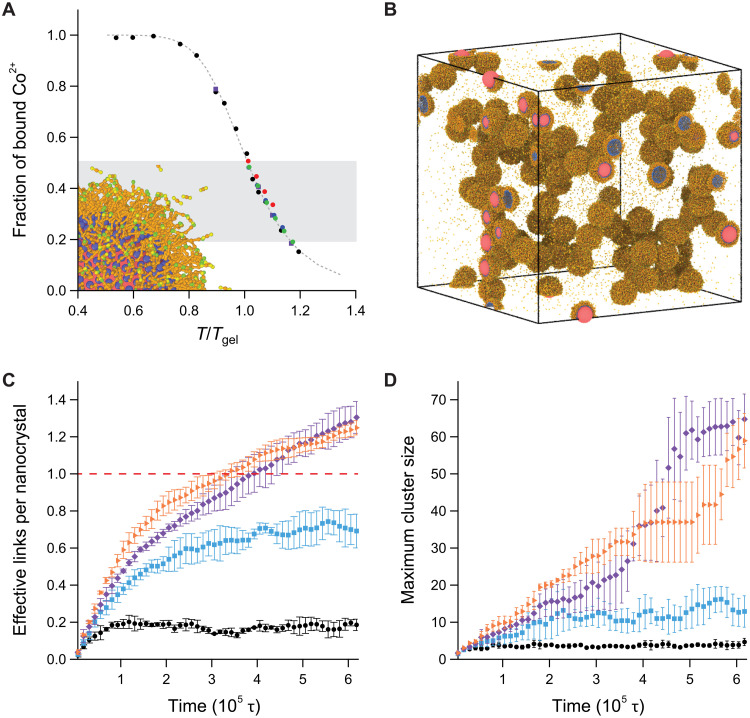
Fig. 5. MD simulations of nanocrystal-linker assembly.
(A) Fraction of bound linkers for single nanocrystal (black dots), 100-nanocrystal simulations (purple squares) and [TBACl] = 100 (red dots), 150 (blue dots), and 200 mM (green dots) samples. The shaded region indicates the range of experimental measurements. A snapshot of a single-nanocrystal simulation includes representations of the nanocrystal (red), bound ends of the ligands (blue), ligand backbones (orange), and bonding sites (yellow and green). (B) Snapshot of the simulation of a 100-nanocrystal system at T/Tgel = 0.89, with the same color coding as in (A). (C) Effective links per nanocrystal for temperature T/Tgel = 1.16, 1.10, 1.05, and 0.89 (black circles, blue squares, purple diamonds, and orange triangles, respectively). (D) Maximum nanocrystal cluster size, with large clusters forming above the threshold of 1.0 effective link per nanocrystal.

