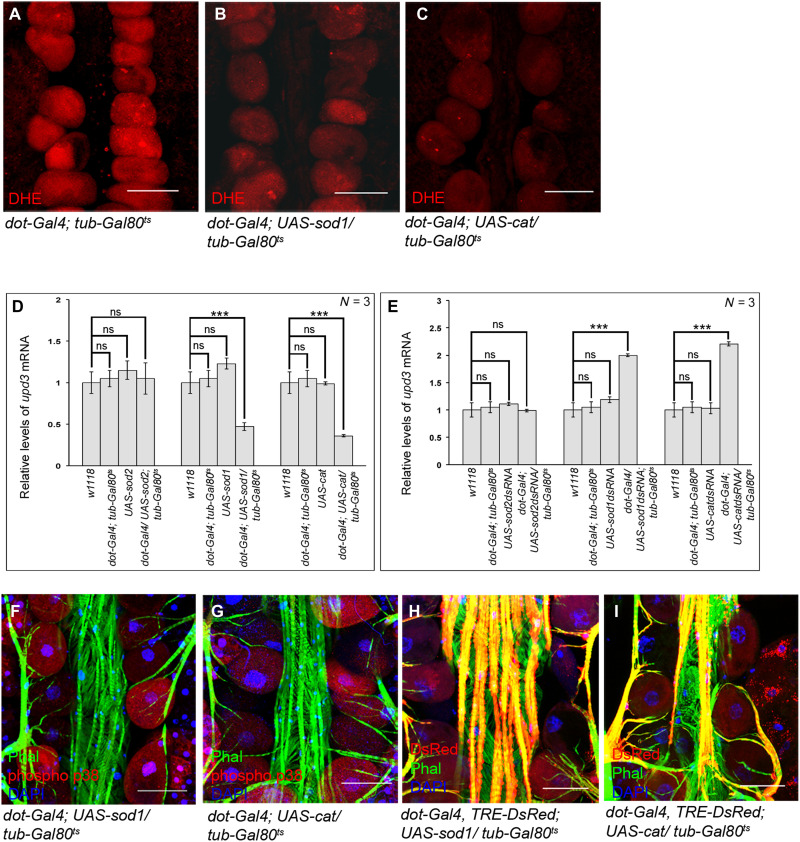
Fig. 6. ROS-dependent activation of p38 and JNK signaling in the PCs.
(A to C) Drop in the levels of ROS (DHE staining; red) in the PCs upon overexpression of SOD1 (B) or Catalase (C) as compared to control (A). (D) Changes in upd3 expression upon overexpression of SOD2, SOD1, and Catalase in the PCs. The transcript levels are normalized to that of the constitutive ribosomal gene rp49. (E) Changes in upd3 expression upon down-regulating the levels of SOD2, SOD1, and Catalase in the PCs. The transcript levels are normalized to that of the constitutive ribosomal gene rp49. (F and G) Reduction in the levels of phosphorylated-p38 (red) in the PCs upon scavenging ROS by overexpression of SOD1 (F) or Catalase (G). Phalloidin (green) marks the cardiac tube and the alary muscles. DAPI (blue) marks the nuclei. (H and I) Drop in TRE-DsRed expression (red) in the PCs upon scavenging ROS by overexpression of SOD1 (H) or Catalase (I). Phalloidin (green) marks the cardiac tube and the alary muscles. DAPI (blue) marks the nuclei. Genotypes are as mentioned. Scale bars, 50 μm in all images. Data are represented as means ± SD. Statistical significance with P values of P < 0.001 is mentioned as ***.

