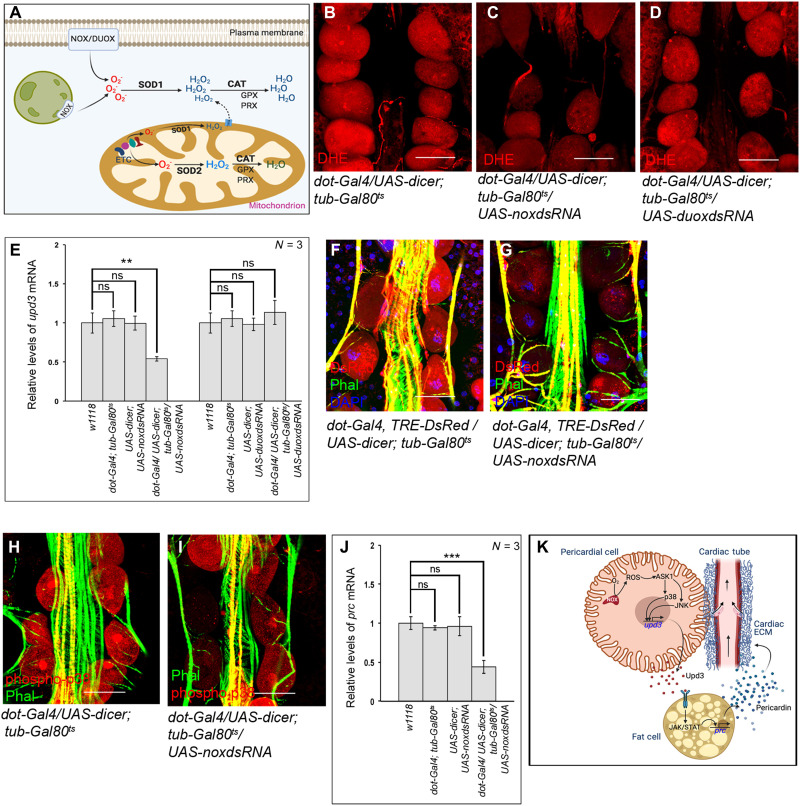
Fig. 8. Nox activity generates physiological levels of ROS in the PCs.
(A) Schematic representation demonstrating the redox homeostasis between generating and scavenging of ROS within a cell. (B to D) Changes in the levels of ROS (DHE staining; red) in the PCs upon knocking down nox (C) and duox (D) as compared to control (B). (E) Changes in upd3 expression upon independently down-regulating nox and duox in the PCs. The transcript levels are normalized to that of the constitutive ribosomal gene rp49. (F and G) Reduction in TRE-DsRed expression (red) in the PCs upon knocking down nox (G) as compared to control (F). Phalloidin (green) marks the cardiac tube and the alary muscles. DAPI (blue) marks the nuclei. (H and I) Drop in the levels of phosphorylated-p38 (red) in the PCs upon knocking down nox (I) as compared to control (H). Phalloidin (green) marks the cardiac tube and the alary muscles. (J) Alteration in the level of prc expression in fat cells after knocking down nox in the PCs. The transcript levels are normalized to that of the constitutive ribosomal gene rp49. (K) Model showing the inter-organ communication circuitry connecting PCs and fat cells to regulate cardiac function by controlling Prc deposition in the cardiac ECM of adult flies. Arrows in the cardiac tube mark the directionality of hemolymph flow. Genotypes are as mentioned. Scale bars, 50 μm in all images. Data are represented as means ± SD. Statistical significance with P values of P < 0.01, and P < 0.001 are mentioned as **, and ***, respectively.

