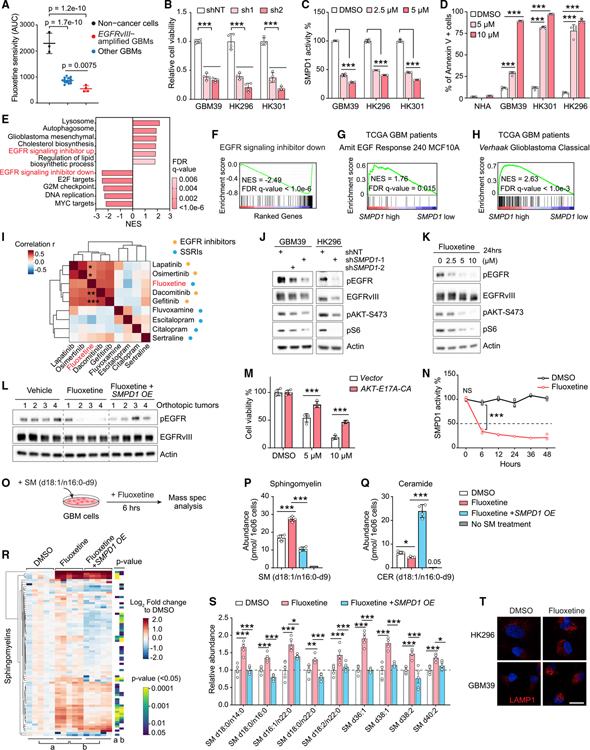
Figure 2. Fluoxetine’s inhibition of SMPD1 blocks oncogenic EGFR signaling in GBM cells.
(A) Fluoxetine sensitivity (area under the cell viability curve) of 3 non-cancer cell lines and 18 patient-derived GBM neurospheres, including 4 EGFRvIII-amplified lines.
(B) Relative cell viability of EGFRvIII-amplified GBM neurosphere lines with SMPD1 or non-targeting shRNAs (n = 4).
(C) SMPD1 enzymatic activity in GBM neurospheres with 24 h of fluoxetine treatment (n = 4).
(D) Percentage of Annexin V-positive cells in normal human astrocytes (NHAs) and GBM neurospheres (n = 4).
(E and F) Gene set enrichment analysis identifies differentially enriched or depleted transcripts in three GBM neurosphere cultures treated with fluoxetine versus DMSO.
(G and H) Gene set enrichment analysis of differentially expressed genes in TCGA GBM clinical samples (HUG133A) with high or low SMPD1 expression.
(I) Drug sensitivity correlation of fluoxetine, 4 EGFR inhibitors, and 4 other SSRI antidepressants in 40 glioma cell lines from the DepMap dataset.
(J) EGFR signaling in indicated GBM cells.
(K) EGFR signaling in GBM39 cells with 24-h treatments.
(L) EGFR phosphorylation in U87EGFRvIII orthotopic xenograft tumors.
(M) Viability of GBM39 cells expressed vector or a constitutively active AKT E17A-CA allele (n = 4).
(N) SMPD1 enzymatic activity in GBM39 cells treated with DMSO or 5 μM fluoxetine (n = 4).
(O) Schematic of sphingomyelin (d18:1/n16:0-d9) metabolomics assay.
(P and Q) Abundance of sphingomyelin (d18:1/n16:0-d9) (P) and ceramide (d18:1/n16:0-d9) (Q) in U87EGFRvIII cells with indicated treatment (n = 4).
(R and S) Lipidomics analysis of endogenous sphingomyelins in U87EGFRvIII cells with 24 h of treatment and with SMPD1 overexpression (n = 5). Relative abundance of representative sphingomyelins is plotted in (S).
(T) LAMP1 staining of GBM cells. Scale bar, 20 μm.
Data represent mean ± SD, except for mean ± SEM in (S). Two-tailed Pearson (I). Two-tailed Student’s t test (R). ANOVA with Tukey’s multiple comparisons test (A–D, M, N, P, Q, and S). *p < 0.05, **p < 0.01, ***p < 0.001. See also Figures S2–S4.

