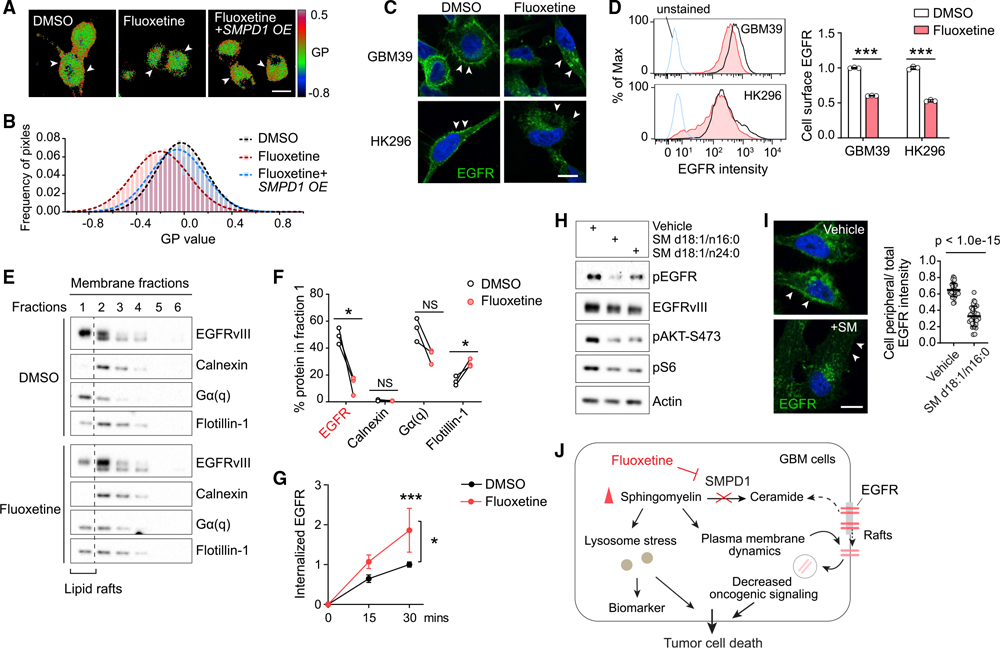
Figure 3. By increasing sphingomyelin levels, fluoxetine causes loss of cell surface EGFR from membrane rafts with subsequent receptor internalization and degradation.
(A and B) Laurdan imaging analysis of membrane lipid order in U87EGFRvIII cells at baseline, after fluoxetine treatment, and with overexpression of an SMPD1 construct. Generalized polarization (GP) images indicate higher membrane order (red) and lower membrane order (blue). Scale bar, 20 μm.
(C and D) Imaging and flow cytometry analysis (n = 3) of cell surface EGFR in GBM cells. Scale bar, 10 μm.
(E) EGFRvIII and marker proteins in the membrane fractions of GBM39 cells. Calnexin is a marker for non-lipid rafts fractions, while Gα(q) and Flotillin-1 are markers of lipid rafts.
(F) Percentage of indicated protein levels in fraction 1, the lipid rafts fraction, which is absent with non-lipid rafts marker Calnexin and present with lipid raft markers Gα(q) and Flotillin-1. Data were normalized to total protein levels of all six fractions (n = 3).
(G) Internalized EGFR of GBM39 cells by flow cytometry (n = 4).
(H) EGFR signaling in GBM39 cells treated with sphingomyelins or vehicle.
(I) EGFR staining in GBM39 cells with SM d18:1/n16:0 treatment. Scale bar, 10 μm.
(J) Schematic model of the fluoxetine-SMPD1 axis in regulating sphingomyelin metabolism and oncogenic receptor signaling of GBM cells.
Data represent mean ± SD. Two-tailed Student’s t test (D, F, and I). ANOVA with Tukey’s multiple comparisons test (G). *p < 0.05, ***p < 0.001. See also Figure S5.

